Figures & data
Table 1. Baseline patient characteristics stratified by ALBI grade.
Figure 1. Kaplan-Meier curves of overall survival in all 349 patients with large HCCs after TACE-MWA.
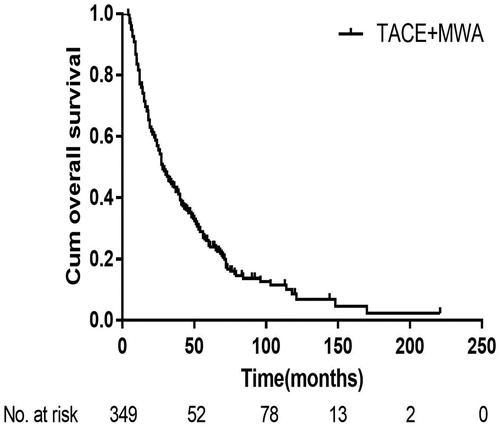
Figure 2. Kaplan-Meier curves of progression-free survival (A) and the progression-free survival stratified by the ablation margin size (B) in all 349 patients with large HCCs after TACE-MWA.
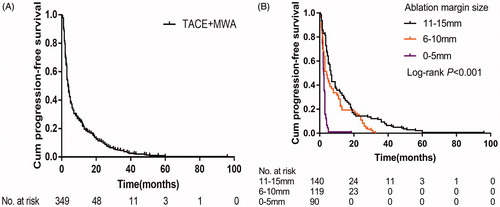
Table 2. Univariable and multivariable predictors of overall survival.
Table 3. Univariable and multivariable predictors of progression-free survival.
Figure 3. Kaplan-Meier curves of overall survival in all 349 patients stratified by the ALBI grade (A), PALBI grade (B), and CTP class (C). ALBI: albumin-bilirubin; PALBI: platelet-albumin-bilirubin; CTP: Child-Turcotte-Pugh.
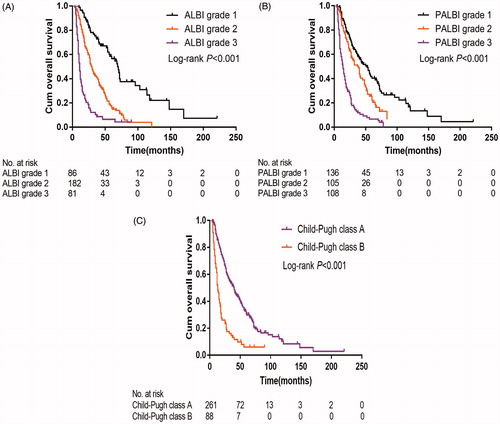
Figure 4. Kaplan-Meier curves of overall survival (A&C) and progression-free survival (B&D) in patients with the CTP class A (A&B) and CTP class B (C&D) stratified by the ALBI grade. ALBI: albumin-bilirubin; CTP: Child-Turcotte-Pugh.
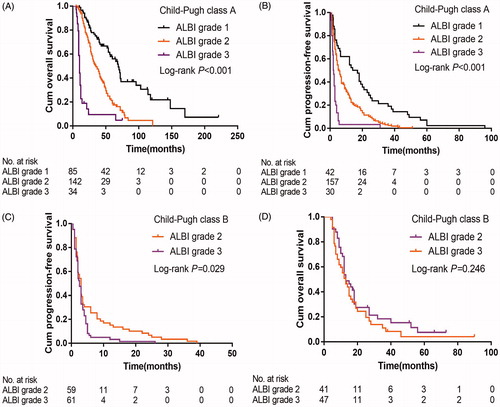
Figure 5. Kaplan-Meier curves of overall survival (A&C) and progression-free survival (B&D) in patients with the CTP class A (A&B) and CTP class B (C&D) stratified by the PALBI grade. PALBI: platelet-albumin-bilirubin; CTP: Child-Turcotte-Pugh.
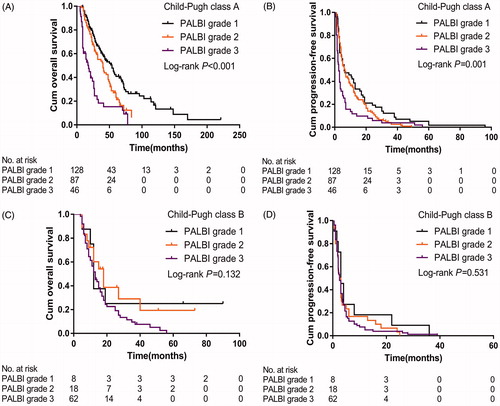
Table 4. Overall survival and progression-free survival stratified by ALBI grade, PALBI grade and CTP class.
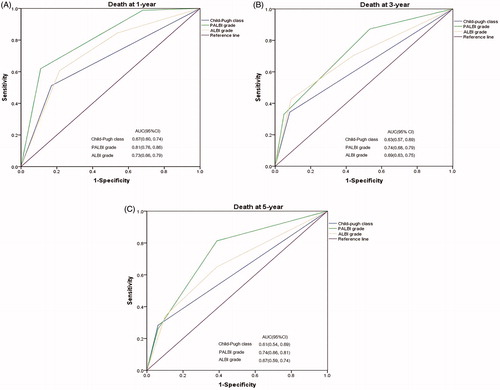
Figure 6. Receiver operating characteristic curves and corresponding AUC for 1-(A), 3-(B) and 5-year (C) OS. ALBI: albumin-bilirubin; APLBI: platelet-albumin-bilirubin; CI: confidence interval; AUC: area under the curve.