
Figures & data
Figure 1. Model of digestive tract and electrode configurations. (A) Geometric parameters of digestive tract model, tumor domain, and normal domain. (B) Schematic drawing of the monopolar model. (C) Schematic drawing of the bipolar model. ML: mucosal layer; SL: submucosal layer; MP: muscularis propria.
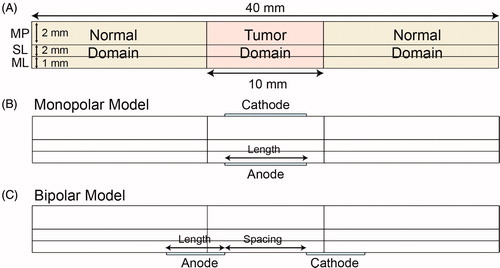
Table 1. Electrical and thermal properties of biological tissue and electrode.
Table 2. Base value, range and step length of each parameter.
Figure 2. Effects of electrode length and pulse voltage on the distribution of electric fields in monopolar model. (A) RAR of EEF in digestive tract for different electrode lengths and pulse voltages. (B) RAR of EEF in mucosa for different electrode lengths and pulse voltages. (C) RAR of EEF in submucosa for different electrode lengths and pulse voltages. (D) RAR of EEF in muscularis propria for different electrode lengths and pulse voltages. (E) Distribution of electric fields for different electrode lengths and voltages. EEF: effective electric field; ML: mucosal layer; MP: muscularis propria; SL: submucosal layer; RAR: relative area ratio; V: voltage; l: electrode length.
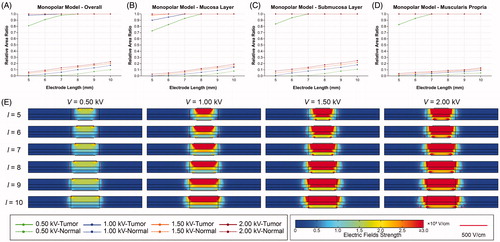
Figure 3. Effects of electrode length and pulse voltage on the distribution of electric fields for different electrode spacing in bipolar model. (A–F) RAR of EEF in digestive tract for different electrode lengths and pulse voltages (d ranges from 5 to 10 mm). (G) Distribution of electric fields for different electrode lengths (V = 1.00 kV, d = 5 mm). (H) Distribution of electric fields for different pulse voltages (d = 5 mm, l = 5 mm). V: voltage; d: electrode spacing; l: electrode length; EEF: effective electric field; RAR: relative area ratio.
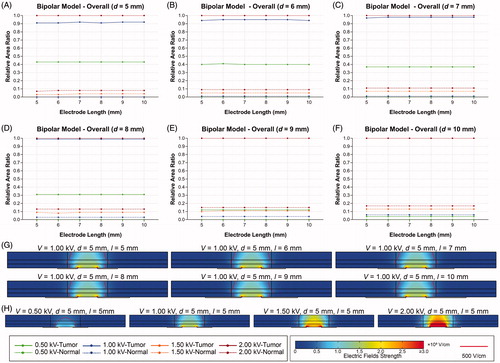
Figure 4. Effects of electrode spacing and pulse voltage on electric field distribution in bipolar model. (A–F) RAR of EEF in digestive tract for different electrode spacing and pulse voltages (l ranges from 5 to 10 mm. (G) RAR of EEF in mucosa for different electrode spacing and pulse voltages. (H) RAR of EEF in submucosa for different electrode spacing and pulse voltages. (I) RAR of EEF in muscularis propria for different electrode spacing and pulse voltages. (J) Distribution of electric fields for different electrode spacing and pulse voltages. V: voltage; d: electrode spacing; l: electrode length; EEF: effective electric field; ML: mucosal layer; SL: submucosal layer; MP: muscularis propria; RAR: relative area ratio.
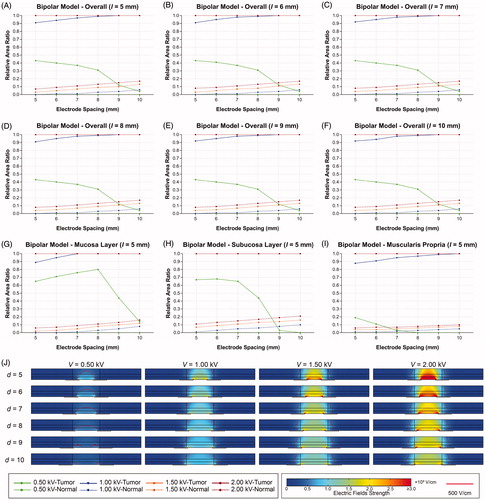
Figure 5. Effects of electrode length and pulse voltage on electrical and thermal injury by 100 pulses in the tumor tissue of the monopolar model. (A) l = 5 mm. (B) l = 6 mm. (C) l = 7 mm. (D) l = 8 mm. (E) l = 9 mm. (F) l = 10 mm. l: electrode length.
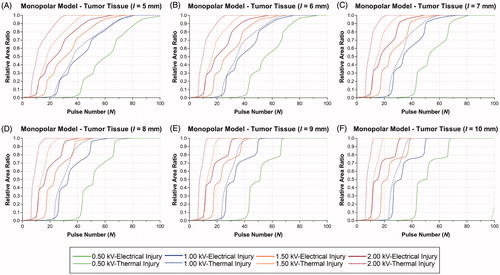
Figure 6. Effects of electrode spacing and pulse voltage on electrical and thermal injury by 100 pulses in the tumor tissue of the bipolar model. (A) d = 5 mm. (B) d = 6 mm. (C) d = 7 mm. (D) d = 8 mm. (E) d = 9 mm. (F) d = 10 mm. d: electrode spacing.
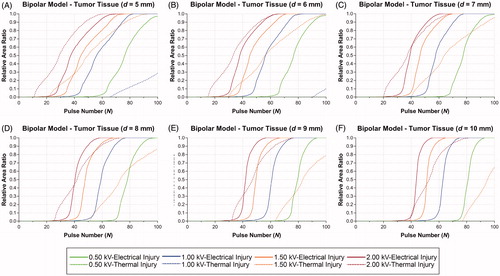
Table 3. Relative area ratio of EI0.99, TI0.99, average temperature of tissue and outcomes at Nmin in the monopolar model.
Table 4. Relative area ratio of EI0.99, TI0.99, average temperature of tissue, and outcomes at Nmin in the bipolar model.
Figure 7. Distributions of electrical conductivity, electric fields, temperature and electrical and thermal injury at Nmin. (A) MPM V = 0.50 kV, l = 5 mm, N = 100. (B) MPM V = 1.00 kV, l = 5 mm, N = 81. (C) MPM V = 1.50 kV, l = 5 mm, N = 72. (D) MPM V = 2.00 kV, l = 5 mm, N = 63. (E) BPM V = 0.50 kV, d = 5 mm, N = 100. (F) BPM V = 1.00 kV, d = 5 mm, N = 82. (G) BPM V = 1.50 kV, d = 5 mm, N = 74. (H) BPM V = 2.00 kV, d = 5 mm, N = 68. EI: electrical injury; TI: thermal injury; OI: overall injury; V: voltage; l: electrode length; N: pulse number; σ: electrical conductivity; E: electric field; T: temperature.
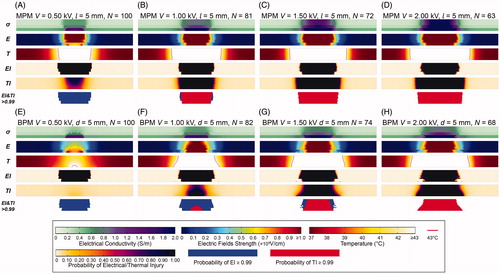
Figure 8. Distributions of electrical injury and thermal injury at Nmin in IRE protocols. (A) BPM V = 0.50 kV, d = 7 mm, N = 100; (B) BPM V = 0.50 kV, d = 8 mm, N = 96; (C) BPM V = 0.50 kV, d = 9 mm, N = 93; (D) BPM V = 0.50 kV, d = 10 mm, N = 92; (E) BPM V = 1.00 kV, d = 7 mm, N = 77; (F) BPM V = 1.00 kV, d = 8 mm, N = 76; (G) BPM V = 1.00 kV, d = 9 mm, N = 75; (H) BPM V = 1.00 kV, d = 10 mm, N = 74; (I) MPM V = 0.50 kV, l = 7 mm, N = 80; (J) MPM V = 0.50 kV, l = 8 mm, N = 75; (K) MPM V = 0.50 kV, l = 9 mm, N = 68; (L) MPM V = 0.50 kV, l = 10 mm, N = 68. V: voltage; d: electrode spacing; N: pulse number; σ: electrical conductivity; E: electric field; T: temperature; EI: electrical injury; TI: thermal injury; OI: overall injury.
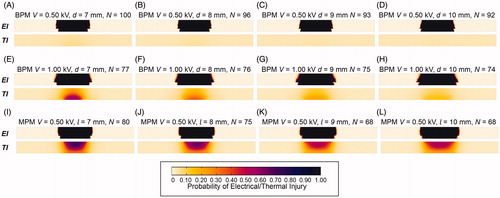
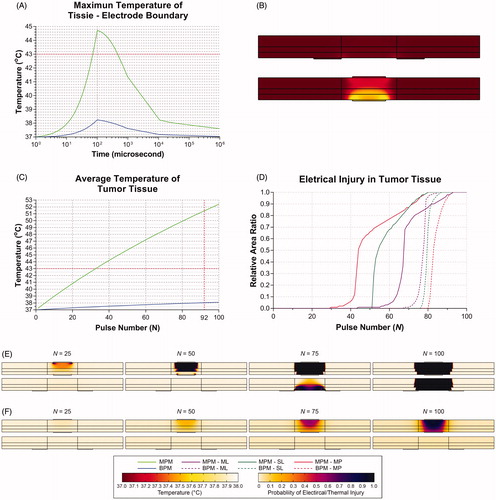
Figure 9. Comparison of the monopolar model (l = 5 mm) and bipolar model (d = 6 mm) at a Voltage of 0.50 kV. (A) Changing trend of temperature during one pulse. (B) Distribution of temperature at the end of one pulse in the MPM (upper) and the BPM (bottom). (C) Changing trend of average temperature in the tumor tissue during 100 pulses. (D) RAR of EI0.99 and TI0.99 in different layers of the digestive tract for 100 pulses in the MPM (solid line) and the BPM (imaginary line). (E) Distribution of electrical injury at 25, 50, 75 and 100 pulses in the MPM (upper) and the BPM (bottom). (F) Distribution of thermal injury at 25, 50, 75 and 100 pulses in the MPM (upper) and the BPM (bottom). V: voltage; d: electrode spacing; l: electrode length; N: pulse number; MPM: monopolar model; BPM: bipolar model; ML: mucosal layer; SL: submucosal layer; MP: muscularis propria.
Supplemental Material
Download PDF (1.5 MB)Supplemental Material
Download PDF (974.1 KB)Data availability statement
The data that support the findings of this study are available from the corresponding author R. Wu and Y. Lv upon reasonable request.