
Figures & data
Figure 1. Schema for treatment on the three arms of the study.
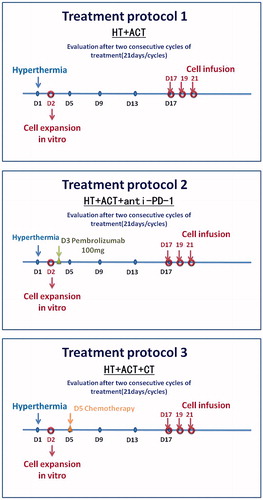
Table 1. Demographics and baseline characteristics of patients (N = 33).
Table 2. Clinical responders and non-responders distribution among enrolled patients.
Figure 2. Serum cytokines secretion were detected and compared by paired t test in different groups. Comparison of IL-2 (A), IL-4 (B), TNF-α (C) IFN-γ (D) IL-6 (E), and IL-10 (F) levels were performed pre and post treatment in different groups of patients according to clinical response.
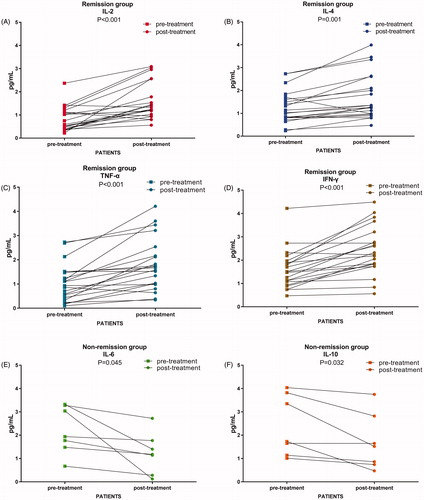
Figure 3. TCR diversity were compared in different group by paired t test. (A, B) Alterations of Shannon index and clonality in all patients; (C, D) Shannon index and clonality significantly changed in tumor remission group, while Shannon index and clonality did not significantly change in Non remission group; (E, F) Unique TCR subclones increased and the shared TCR subclones decreased in patients with tumor remission; (G, H) The unique and the shared TCR subclones had no significant changes in patients of non-remission group.
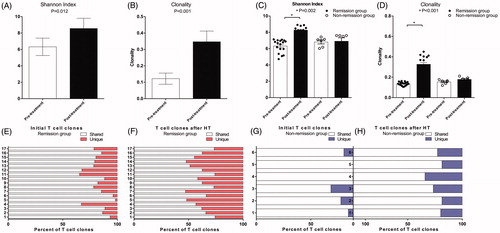
Figure 4. Peripheral blood T cell phenotype measurements via cytometry before and after the treatment. CD8+/CD28+ (E) T cell subset was significantly increased after the combined treatment (p < 0.05); CD4+/CD25+/CD127+ (D) cell subset was significantly decreased after the combined treatment (p < 0.05); CD3+ (A), CD3+/CD4+ (B), and CD3+/CD8+ (C) and CD8+/CD28− (F) cell subsets were not significantly changed after the combined treatment (p > 0.05).
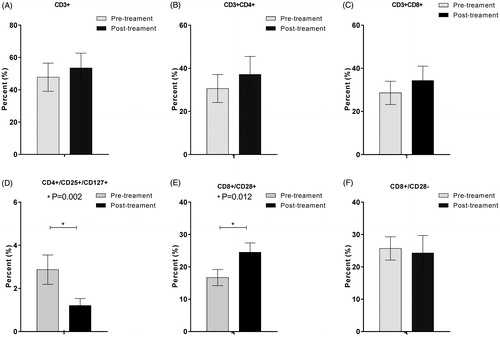
Table 3. Summary of hematological and treatment-associated adverse events.