Figures & data
Figure 1. Illustrates the progression of the freezing process in a population of cells. (A) The progression of extracellular ice formation during the initial freezing process. (B) Extracellular ice has completely surrounded the cells with approximately half of the cells experiencing intracellular ice. (C) All cells are frozen intracellularly.
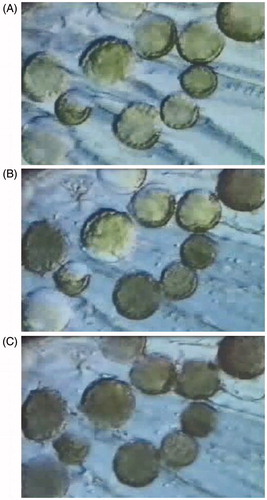
Figure 2. Illustrates the freeze progression of single cell. In each figure temperature in degrees Celsius appears in the upper left and time in seconds appears in the upper right. (A) Cooling has proceeded to −1 °C without ice formation. (B) Extracellular has surrounded the cell without damage. (C) Illustrates the consequences of intracellular ice formation with extensive membrane rupture and expulsion of cellular content.
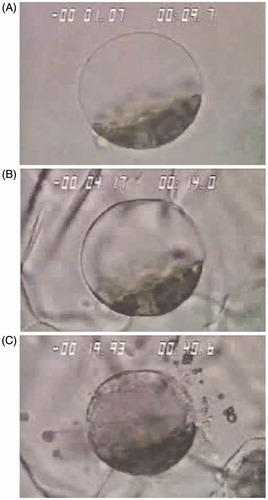
Table 1. Cellular stress events during cryoablation.
Table 2. Defensive strategies of cancer cells.
Figure 3. A schematic representation of the dynamics and events of the freeze zone.
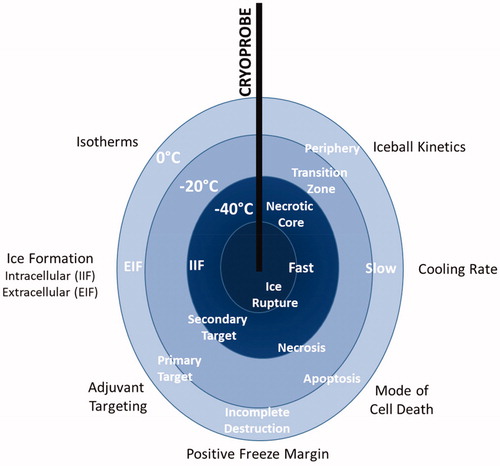
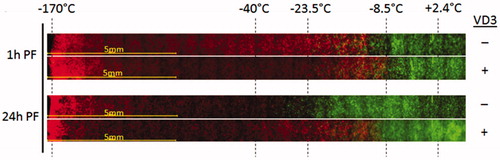
Figure 4. Prostate cancer TEM model results of a 5 min cryosurgical procedure with a supercritical nitrogen device. For VD3 + samples, pTEMs were pretreated for 24 h with 50 nM calcitriol prior to the freeze exposure. TEM samples were frozen, allowed to thaw and assessed for viability 1 h or 24 h post freeze using Calcein-AM (green, live cells) and propidium iodide (red, dead cells). Images depict the center of the freeze zone (left side) to the iceball edge and non-frozen section (right side). Temperature during freezing were monitored with embedded thermocouples during the freeze and end point temperatures at their respective position in the samples are indicated. At 1 h post-freeze, both freeze only and VD3/freeze samples reveal cellular damage out to ∼−10 °C. At 24 h, in the freeze only samples most of the cells in the −10 °C to −25 °C region recovered revealing complete cell death below ∼−30 °C. In VD3/freeze samples, cellular recovery was significantly reduced resulting in complete cell destruction below ∼−10 °C.