Figures & data
Figure 1. Flowchart of group assignment.
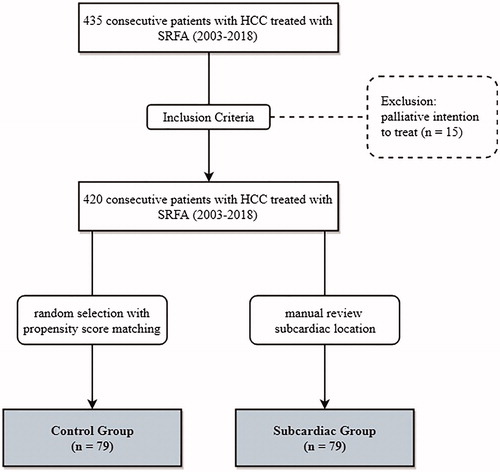
Table 1. Patient characteristics of 79 patients undergoing 104 SRFA sessions of 114 HCCs in the subcardiac group and of 79 patients undergoing 125 SRFA sessions of 242 HCCs in the control group.
Figure 2. Case of a 54-year old female with a 6-cm subcardiac HCC in segment II. (A) Arterial phase initial CT with a hypervascular hepatocellular carcinoma (HCC) in segment II (red dashed circle). (B) Maximum intensity projection (MIP) image of the control CT with 6 coaxial needles in place (red arrowhead). (C and D) Screenshots of the Treon navigation system – (C) showing fused images of the arterial phase planning CT with the arterial phase control CT (D). The red dashed circle delineates the HCC before and after ablation. (D) shows a completely overlapping ablation zone with no evidence of residual tumor and a sufficient safety margin. Follow up CT and after 3 (E) and MRI after 24 months (F) showing no evidence of local tumor recurrence. (E and F) with the red dashed circle delineating ablation zones. Note a pancreatic pseudocyst (red arrowhead) as an incidental finding.
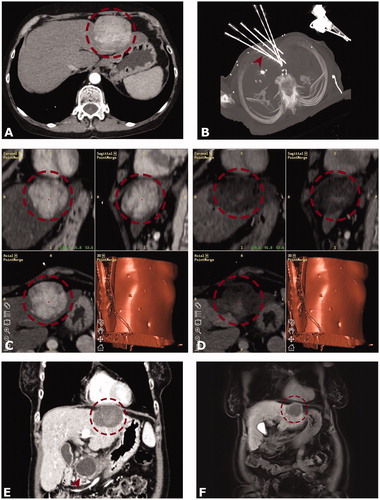
Figure 3. Case of a 75-year old male with a 4 cm hepatocellular carcinoma (HCC) between the heart, remaining left hepatic vein and inferior vena cava. Note the lipiodol deposition indicating a prior transcatheter arterial chemoembolization (TACE) and the surgical clips indicating a prior extended right hemihepatectomy. (A and B) Arterial phase CT mages from the navigation system in three planes (A, HCC marked by red dashed circle) and images of the 3-dimensional needle path planning (B). The red arrowhead shows the position of a placed co-axial needle. (C) Maximum intensity projection (MIP) of control CT with three coaxial needles in place. The needle from image (B) is marked by a red arrowhead. (D and E) Follow-up CT after 6 months (D) and 24 months. (E) showing no evidence of local tumor recurrence (red dashed circle is marking the coagulation zone).
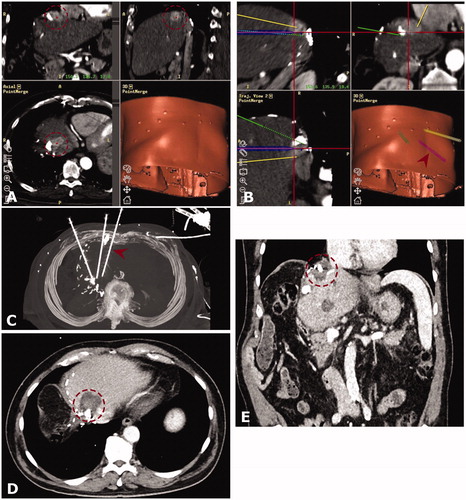
Table 2. Details of major complications of the subcardiac group.
Table 3. Tumor-based therapy success rates in the subcardiac and control groups.
Table 4. Details of unsuccessful local tumor control of subcardiac tumors following SRFA.
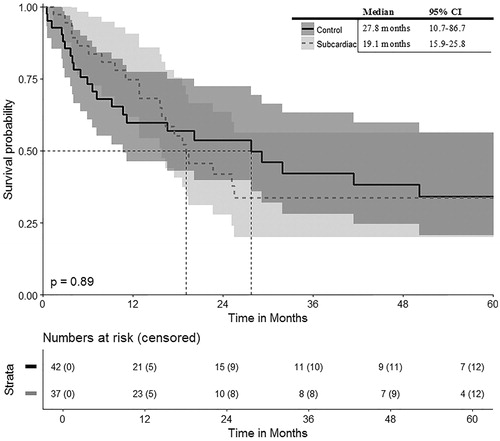
Figure 4. Overall Survival from the date of initial SRFA for patients with exclusively singular HCCs.
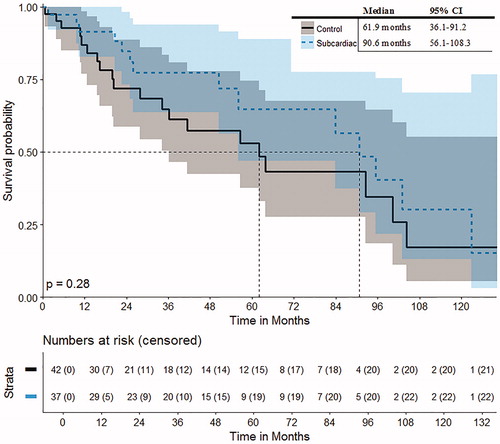
Figure 5. Disease-free survival from the date of initial SRFA for patients with exclusively singular HCCs.