Figures & data
Figure 1. Schematic diagrams of the HIFU irradiation of (A) a BCG suspension and (B) a subcutaneous BCG abscess.
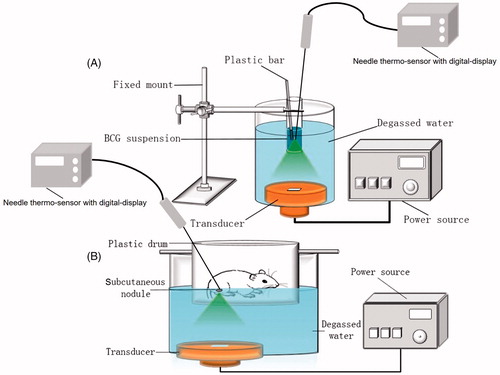
Figure 2. The effect of HIFU irradiation on BCG viability. After HIFU treatment, colony counts were performed on (A) BCG bacterial culture suspensions in vitro and (B) BCG abscess tissue homogenates in vivo. (C) Bacterial viability was observed after HIFU irradiation. Cell were SYTO 9 (green) and PI (red) double-stained and viewed under a laser scanning confocal microscope (×100). (D) The percentage of viable cells (green) was calculated as the intensity of the green fluorescence divided by that of the red fluorescence. The intensities of 10 randomly-selected fields of view per sample were determined.
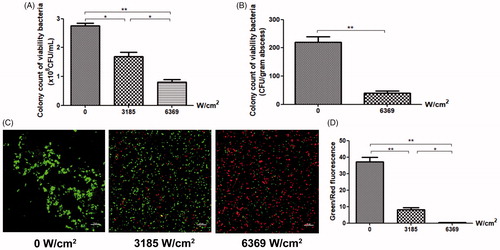
Figure 3. BCG structures and mycelial morphologies were observed under TEM and SEM, respectively, after irradiation with different HIFU intensities. The cell wall was intact in the control group. The BCG cytoplasm was partially coagulated into blocks (red arrow) in the 3185 W/cm2 group. The cell wall was broken, with leaked cytoplasm, and the membrane organelles were swollen and lysed (red arrow) in the 6369 W/cm2 group. The BCG cell wall was shrunken and depressed in 3185 W/cm2 group (blue arrow); broken and bulging cells with spilled cytoplasmic contents were observed in the 6369 W/cm2 group (blue arrow).
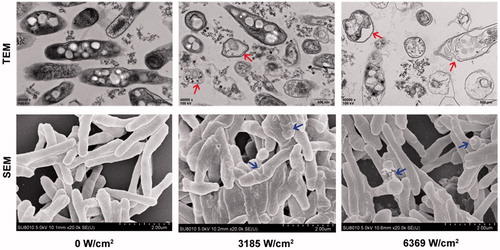
Figure 4. Sonogram showing subcutaneous nodules before and after HIFU ablation. (A) Before HIFU irradiation, the subcutaneous nodules in the rats were internally hypoechoic. (B) After HIFU irradiation, the target area was hyperechoic.
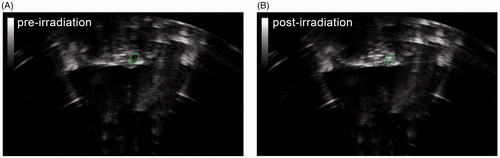
Table 1. Temperature changes at different intensities of HIFU irradiation in vitro and in vivo.
Figure 5. The growth curves of the subcutaneous abscesses with and without HIFU treatment. (A) Representative images of the subcutaneous abscess and the dissected abscess. (B) Growth curves of the BCG abscesses in rats that did not undergo surgical resection after HIFU ablation. The abscess volume in the HIFU-ablation group was smaller than that of the sham group (*p<.05, **p<.01).
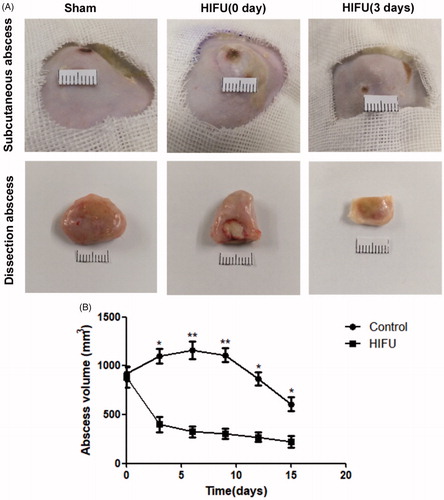
Figure 6. Subcutaneous nodules were sectioned, and stained with H&E and acid-fast. HIFU did not damage the epidermal or dermal tissues (white arrows). The black arrow indicates the central nucleus dissolution in the center of the coagulative necrotic region after HIFU ablation, with nuclear pyknosis and fragmentation in the periphery. H&E-stained images were taken at ×20 magnification, and the acid-fast staining images were taken at ×100 magnification.
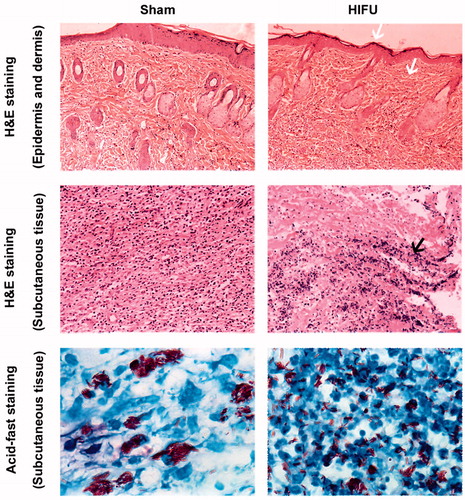
Figure 7. The frequency spectrum of the emissions generated during HIFU irradiation at ultrasonic intensities of (A) 3185 W/cm2 and (B) 6369 W/cm2. Broadband emission signals were detected throughout the entire 15-s HIFU process under atmospheric pressure (C: at 3185 W/cm2; D: at 6369 W/cm2; E:cumulative).
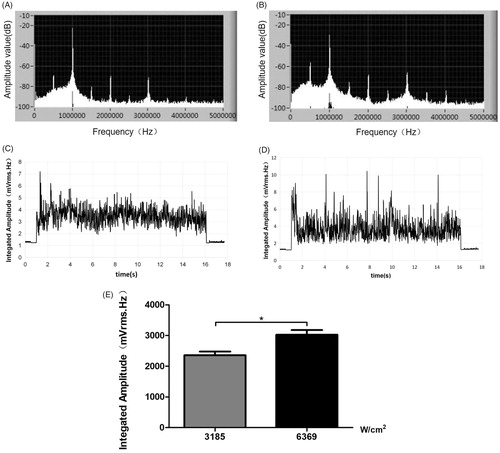
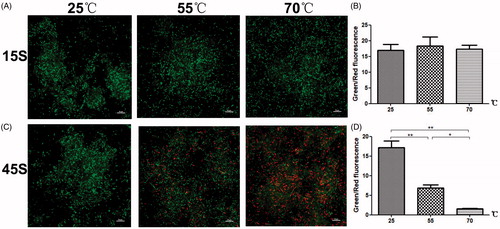
Figure 8. The effects of temperature on BCG viability. Bacterial viability was observed after treatment at different temperatures for (A) 15 s and (C) 45 s. Cells were SYTO 9 (green) and PI (red) double-stained and viewed under a laser scanning confocal microscope (×100). (B), (D) The percentage of viable cells (green) was calculated as the intensity of the green emissions divided by that of the red emissions. The intensities of 10 randomly-selected fields of view per sample were determined (*p<.05, **p<.01).