1,957
Views
37
CrossRef citations to date
0
Altmetric
Original Articles

Ultrasound-guided laser ablation versus surgery for solitary papillary thyroid microcarcinoma: a retrospective study

, , , , &
Pages 896-903 | Received 16 Jun 2019, Accepted 24 Jul 2019, Published online: 29 Aug 2019

Figures & data

Figure 1. (a) A 45-year-old man had a suspicious hypoechoic lesion (arrow) measured 5.3 × 3.7 × 3.0 mm in the right thyroid lobe. (b) A 300-m plane-cut optic fiber was inserted through the introduced needle (arrow head). During the ablation, the typical hyperechoic region (arrow) occurred surrounding the tip of the fiber due to formation of gas.

Figure 1. (a) A 45-year-old man had a suspicious hypoechoic lesion (arrow) measured 5.3 × 3.7 × 3.0 mm in the right thyroid lobe. (b) A 300-m plane-cut optic fiber was inserted through the introduced needle (arrow head). During the ablation, the typical hyperechoic region (arrow) occurred surrounding the tip of the fiber due to formation of gas.

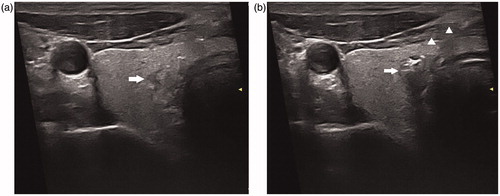
Table 1. Patients and PTMCs characteristics in the two groups.

Figure 2. (a) Before LA, transverse ultrasound image revealed a hypoechoic nodule (arrow) with an ill-defined border 56.2 mm3 in volume, which was confirmed as a papillary thyroid microcarcinoma. (b) After LA, the necrotic area (arrow) 684.6 mm3 in volume was significantly larger than the target tumor on CEUS. (c) Ultrasound examination showed that the ablated lesion completely disappeared at the last follow up.

Figure 2. (a) Before LA, transverse ultrasound image revealed a hypoechoic nodule (arrow) with an ill-defined border 56.2 mm3 in volume, which was confirmed as a papillary thyroid microcarcinoma. (b) After LA, the necrotic area (arrow) 684.6 mm3 in volume was significantly larger than the target tumor on CEUS. (c) Ultrasound examination showed that the ablated lesion completely disappeared at the last follow up.

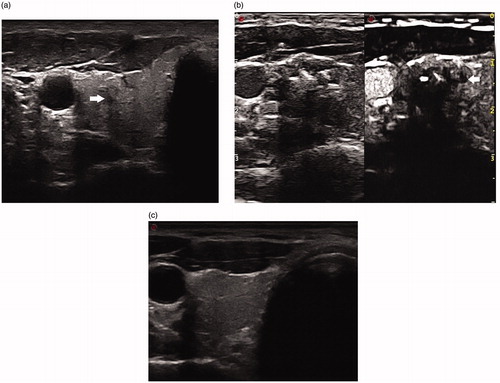
Table 2. Size and volume change of the ablated zone in the LA group.

Figure 3. The graph demonstrated recurrence-free survival curves for patients treated with surgery and LA.

Figure 3. The graph demonstrated recurrence-free survival curves for patients treated with surgery and LA.

Table 3. Complications after surgery versus LA.

Table 4. Treatment response after surgery versus LA.