Figures & data
Figure 1. RFA enhances lymphocyte-HEV interactions in TdLN. (A) Scheme for experimental design to investigate the immunomodulatory effect of RFA in TdLN and cLN. (B) Representative photomicrographs and quantification of TRITC-labeled naïve OT-I CD8+ T cells (red) in cLN and TdLN of C57BL/6 mice bearing B16-OVA tumors after sham procedure or RFA. LN were counterstained for PNAd to identify cuboidal endothelium lining HEV (green). (C, D) In vivo short-term (1 hour, left; 12 hour, right) homing of TRITC-labeled naïve (C) or activated (D) clone 4 CD8+ T cells in TdLN and cLN from BALB/c mice bearing CT26-HA tumors after sham procedure or RFA. Data are the mean ± SEM of ≥10 fields for non-sequential cyrosections analyzed from independent mice (n = 3 mice per group) and are representative of 2 experiments. ***p < 0.001 by unpaired, two-tailed Student’s t-test. Scale bars (B–D), 100 μm.
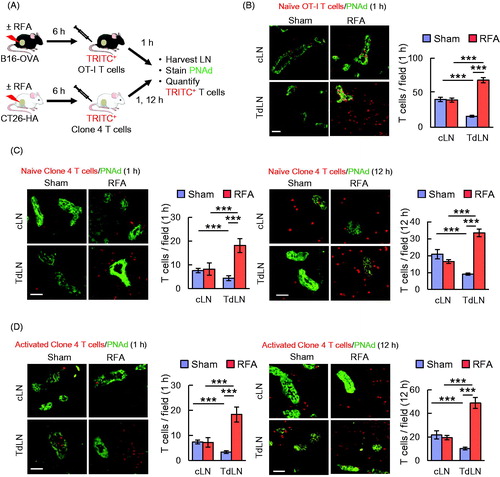
Figure 2. RFA selectively increases the expression of CCL21 and ICAM-1 on HEV in TdLN. (A) Intravascular staining of CCL21 in cLN and TdLN by iv injection of primary Ab at 6 hours after RFA or sham procedure in CT26-bearing BALB/c mice. Organs obtained 20 min later were counterstained with fluorochrome-conjugated secondary Ab to detect anti-CCL21 Ab (red) and with anti-PNAd Ab (green) to demark the position of HEV. (B) Representative histograms for experiment shown in (A). Histograms denote quantitative image analysis of the mean fluorescence intensity (MFI) for fluorescence of PNAd (from tissue section staining) and CCL21 (from intravascular staining) in PNAd+ cuboidal LN HEV. Horizontal axes, fluorescence intensity; vertical axes, pixels with each intensity; numbers in plots, MFI. (C) Intravascular staining for ICAM-1 (red) in cLN and TdLN of CT26-bearing mice at 6 hours following sham or RFA treatment. LN were counterstained with anti-PNAd Ab (green) to identify HEV. (A–C) Scale bars, 100 μm; numbers in photomicrographs and histograms indicate MFI for quantification of all pixels analyzed within the HEV for ≥10 fields in non-sequential cryosections for individual mice. Data are representative of 2 independent experiments.
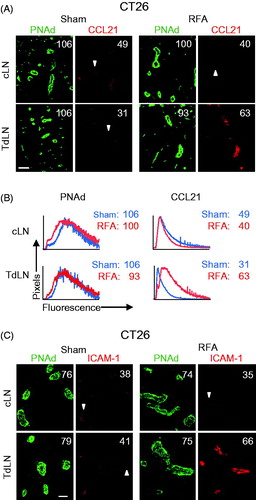
Figure 3. RFA increases homing of lymphocytes to TdLN by enhancing secondary firm adhesion in HEV. (A) Kinetics of intravascular ICAM-1 induction by RFA in cLN and TdLN in C57BL/6 mice bearing B16F10 tumors. The position of HEV is demarked by PNAd staining of LN. Numbers indicate MFI for total pixels analyzed within area designated as HEV (i.e. ≥10 fields for non-sequential cryosections were analyzed per treatment group). Data are representative of 2 independent experiments. Scale bars, 100 μm. (B,C) Calcein-labeled lymphocytes were adoptively transferred into recipient C57BL/6 mice bearing B16-OVA tumors at 6 hours after sham or RFA treatment and their interactions within the LN venular tree were analyzed by IVM. Mean rolling fractions (B) and sticking fractions (C) ± SEM in TdLN are shown. Data are from three independent experiments (n = 3 mice/group). *p < 0.05 and **p < 0.01 by unpaired, two-tailed Student’s t-test.
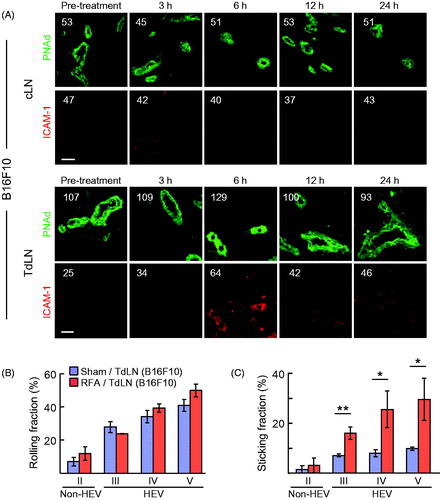
Figure 4. RFA augments ICAM-1 and trafficking of adoptively transferred in vitro-activated CD8+ T cells in tumor vessels. (A, B) Intravascular staining of ICAM-1 in CT26-HA tumor (A) or B16-OVA tumor (B). Tumor-bearing mice were injected iv with ICAM-1 Ab 6 hours after RFA or sham treatment. Twenty minutes after injection, tumors were harvested and cryosections were counterstained with TRITC-conjugated secondary Ab (red) and anti-CD31 Ab (green) to identify vessel position. Numbers indicate MFI determined by quantification of all pixels analyzed within CD31+ vessels in ≥10 fields of non-sequential cryosections for each treatment group. (C) Schematic illustration investigating immunomodulatory effect of RFA in BALB/c mice bearing CT26-HA tumors. Representative photomicrographs and quantification of TRITC-labeled activated Clone 4 splenocytes (red) in the indicated organs (CT26-HA tumor, pancreas, and spleen) counterstained for CD31+ vessels (green) 1 hour or 12 hours after sham procedure or RFA. (D) Schematic of experimental design to investigate leakage of cells after RFA in BALB/c mice bearing CT26-HA tumor. Representative photomicrographs and quantification of TRITC-labeled RBC (red) in CT26-HA tumors or TdLN 2 hours after sham procedure or RFA; tumor tissues counterstained for CD31+ vessels and LN were stained for PNAd+ HEV (green). ***p < 0.001; ns: not significant as determined by unpaired, two-tailed Student’s t-test. Scale bars, 100 μm; data are mean ± SEM of ≥10 fields analyzed from independent mice (n = 3 mice per group) and are representative of 2 experiments.
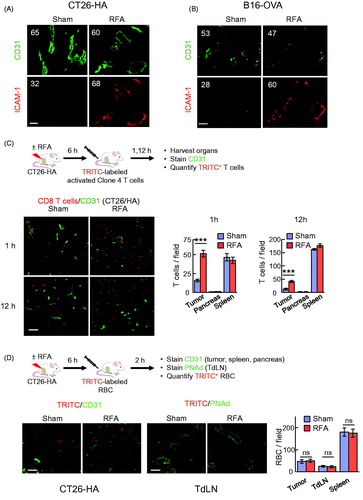
Figure 5. RFA augments antigen-restricted killing of tumor targets by adoptively transferred CD8+ T cells. (A) Schematic for experimental design to investigate RFA augmentation of antigen-directed killing and representative photomicrographs of B16-OVA tumors at 12 hours after ACT using TRITC-labeled in vitro-activated OT-I cells (red). Apoptotic cells were detected by TUNEL assay (green) and nucleated cells were stained with DAPI (blue). Scale bar: 100 μm. (B, C) Quantification of adoptively transferred TRITC-labeled in vitro-activated OT-I cells (B) and TUNEL+ apoptotic cells (C) in B16-OVA and parental B16F10 tumors. Data are mean ± SEM of 5–10 fields analyzed from non-sequential cryosections of independent mice (n = 3 mice per group) and are representative of 2 experiments. ***p < 0.001 and **p < 0.01 by unpaired two-tailed Student’s t-test.
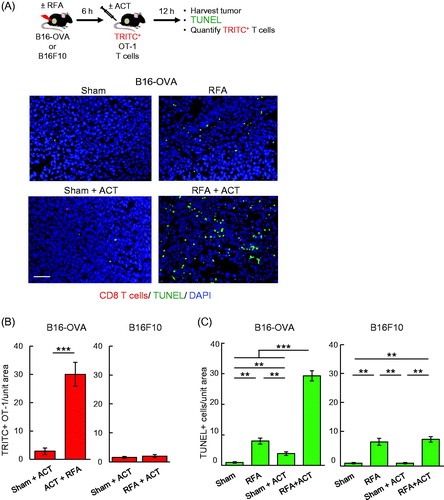
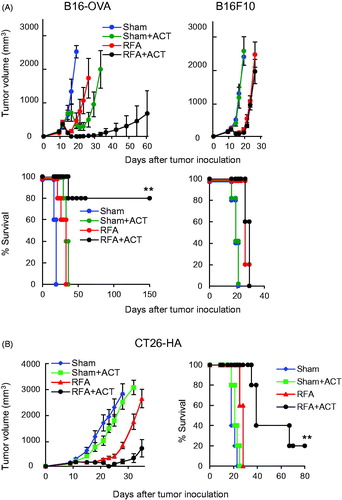
Figure 6. In situ immune modulation with RFA augments antitumor efficacy of adoptively transferred CD8+ T cells. Tumor growth curves and survival curves for mice bearing B16-OVA and parental B16 tumors (A) or CT26-HA tumors (B) in different treatment groups (n = 5 mice per group). Tumor-bearing mice were treated with sham procedure or RFA. Six hours after the procedure, ACT was administered by iv transfer of 1 × 10⁶ in vitro-activated OT-I (A) or Clone 4 (B) CD8+ T cells. (A, B) For survival data, **p < 0.01 for RFA + ACT group compared to all other groups as determined using log-rank (Mantel–Cox) test.