
Figures & data
Table 1. Individual thicknesses of skin and fat layers, and body core temperature before and immediately after wIRA-irradiation of piglets p2–p12, divided into three groups according to the different irradiances (IR-A) applied.
Figure 1. Spectral irradiance of the wIRA irradiator as a function of wavelength [irradiator type: hydrosun 750 (hydrosun, Müllheim, Germany), equipped with a cutoff filter (type BTE 595, BTE Elsoff, Germany)]. Measurements were performed at longitudinal distances of 37 cm (curve 1), of 42 cm (curve 2) and of 47 cm (curve 3) between the center of the exit window of the irradiator and the center of the radiation entrance window of the spectroradiometer. Both windows were parallel to each other.
![Figure 1. Spectral irradiance of the wIRA irradiator as a function of wavelength [irradiator type: hydrosun 750 (hydrosun, Müllheim, Germany), equipped with a cutoff filter (type BTE 595, BTE Elsoff, Germany)]. Measurements were performed at longitudinal distances of 37 cm (curve 1), of 42 cm (curve 2) and of 47 cm (curve 3) between the center of the exit window of the irradiator and the center of the radiation entrance window of the spectroradiometer. Both windows were parallel to each other.](/cms/asset/9e1ae709-3fa2-4478-a08b-81055491d8ab/ihyt_a_1655594_f0001_c.jpg)
Table 2. Incident irradiance in the spectral range of IR-A (780–1400 nm), in the ‘total’ spectral range of spectroradiometric measurement (380–1700 nm) and in the ranges of VIS1 (380–590 nm), of VIS2 + IR-A (590–1400 nm) and of IR-B* (1400–1700 nm) as part of the spectral range of IR-B (1400–3000 nm) in the center of the irradiated skin area as a function of longitudinal distances between this area and the exit window of the irradiator.
Figure 2. Relative irradiance (%) as a function of the lateral distance to the center, normalized to the value measured at the center of the exposed/irradiated area at longitudinal distances of 37, 42 and 47 cm.
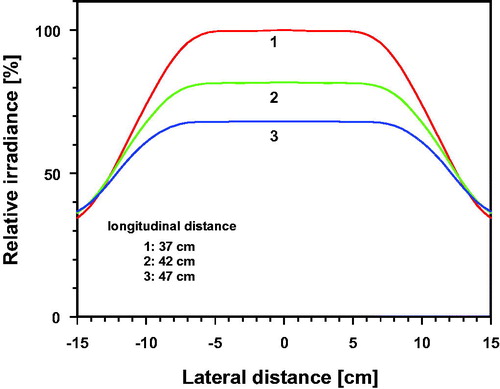
Figure 3. Template for sensor positions and indication of depths at which temperature measurements were performed (left), marked target field with inserted temperature sensors (right). The sensors were inserted with the aid of catheters (Type SURFLO IV Catheter and SUPERFLASH IV Catheter, TERMURO, Tokyo, Japan).
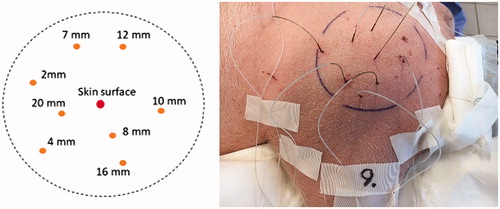
Figure 4. Surface temperature (curve 1), tissue temperatures at depths of 2–20 mm (curves 2–9) and body core temperature (curve 10) of selected piglets during and after wIRA-irradiation as a function of time. The following incident irradiances (IR-A) were chosen: 126.5 mW cm−2 (a: p3, d: p2), 103.2 mW cm−2 (c: p6) and 85.0 mW cm−2 (b: p10).
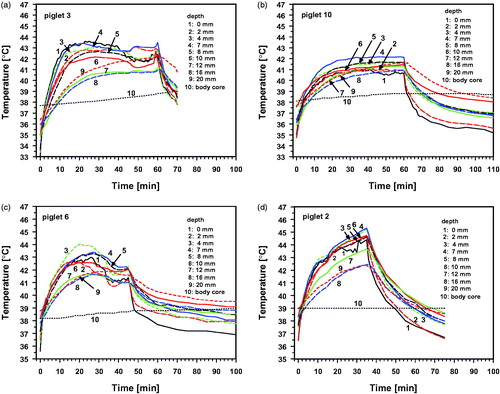
Figure 5. Tissue temperature of piglets p2 and p3 [d and a, exposed to wIRA with 126.5 mW cm−2 (IR-A)], of piglet p10 [b, exposed to 85.0 mW cm−2 (IR-A)] and of piglet p6 [c, exposed to 103.2 mW cm−2 (IR-A)] as a function of tissue depth before (curves 0) and during various irradiation at times.
![Figure 5. Tissue temperature of piglets p2 and p3 [d and a, exposed to wIRA with 126.5 mW cm−2 (IR-A)], of piglet p10 [b, exposed to 85.0 mW cm−2 (IR-A)] and of piglet p6 [c, exposed to 103.2 mW cm−2 (IR-A)] as a function of tissue depth before (curves 0) and during various irradiation at times.](/cms/asset/a2262e91-4d61-4bab-a0a6-9df3789257d1/ihyt_a_1655594_f0005_c.jpg)
Table 3. Phases of temperature response upon wIRA-irradiation.
Figure 6. Mean values and standard deviations of temperatures during wIRA-irradiation with incident irradiances (IR-A) of 126.5 mW cm−2 (group 1, p3–p5), 103.2 mW cm−2 (group 2, p6–p9) and 85.0 mW cm−2 (group 3, p10–p12) as a function of irradiation time at the skin surface (a) and at tissue depths between 2 and 7 mm (b–d). Broken line: upper temperature limit in ‘sensitizing’ hyperthermia (43 °C).
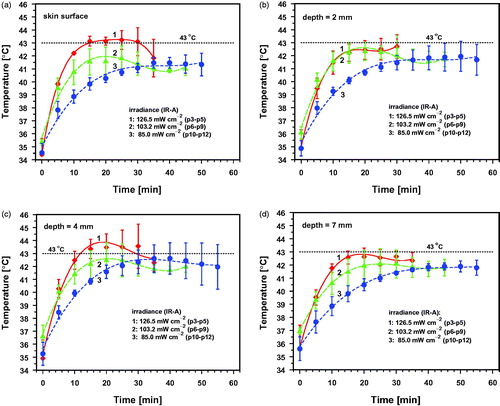
Figure 7. Mean values and standard deviations of temperatures during wIRA-irradiation with incident irradiances (IR-A) of 126.5 mW cm−2 (group 1, p3–p5), 103.2 mW cm−2 (group 2, p6–p9) and 85.0 mW cm−2 (group 3, p10–p12) as a function of irradiation time at tissue depths between 10 and 20 mm (a–d). Broken line: upper temperature limit in ‘sensitizing’ hyperthermia (43 °C).
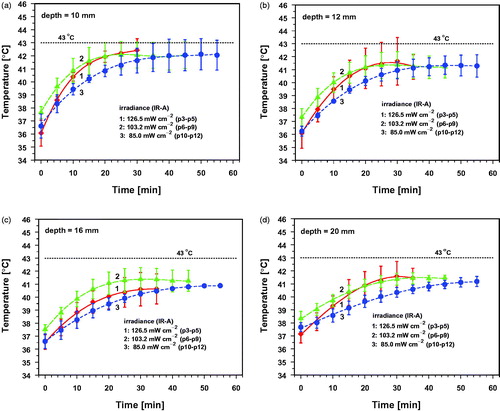
Figure 8. Mean values and standard deviations of temperatures before wIRA-irradiation (group 0, p3–p12), and after irradiation times of 5 min (a), 10 min (b), 20 min (c) and 30 min (d) with an incident irradiance (IR-A) of 126.5 mW cm−2 (group 1, p3–p5), 103.2 mW cm−2 (group 2, p6–p9) and 85.0 mW cm−2 (group 3, p10–p12) as a function of tissue depth.
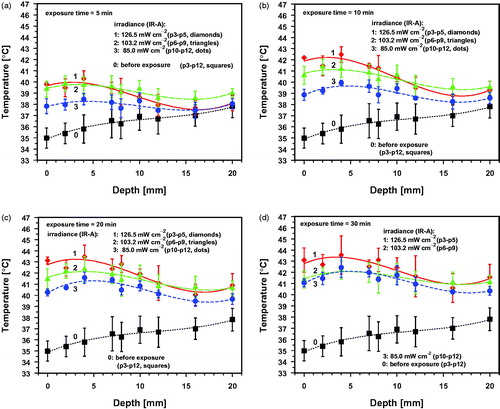
Figure 9. wIRA-irradiation times needed to reach target temperatures of 39 °C (a), 40 °C (b), 41 °C (c), 42 °C (d) and 43 °C (e) as a function of tissue depth during wIRA exposure with 126.5 mW cm−2 (p3–p5, group 1, red diamonds and lines), 103.2 mW cm−2 (p6–p9, group 2, green triangles and lines) and 85.0 mW cm−2 (p10–p12, group 3, blue dots and lines). Means and standard deviations of all piglets of the group reaching the target temperature (solid symbols). Individual data: only one or a few piglets of the group reaching the target temperature (open symbols).
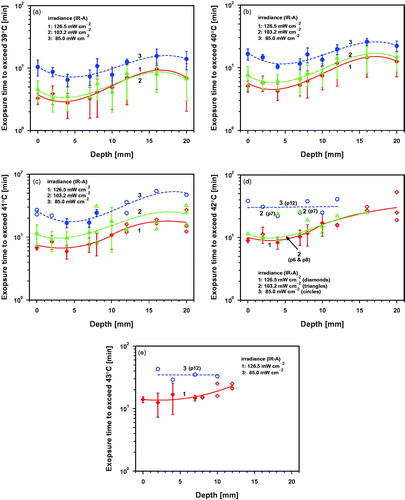
Figure 10. Time to reach the post-irradiation hyperthermia level (PIHL) of 39 °C after wIRA exposure with 126.5 mW cm−2 (p3–p5, group 1, red diamonds and line), 103.2 mW cm−2 (p6–p9, group 2, green triangles and line) and 85.0 mW cm−2 (p10–p12, group 3, blue dots and line).
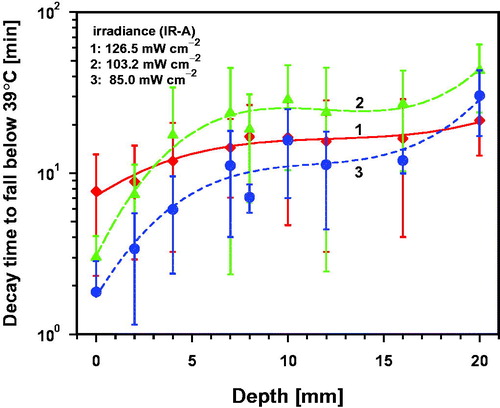
Table 4. Means and standard deviations (σ) of maximum temperature (Tmax) and thermal steady-state temperatures (SST) at the skin surface and at different tissue depths upon wIRA-irradiation.
Table 5. Depth of heated tissue after 30 min of wIRA-irradiation as a function of (i) irradiance (IR-A) for different mean temperatures (Tmean) according to , of (ii) the temperatures at the lower limit of standard deviation (Tσl) according to Equation (1) and Figure S13d, and of (iii) the temperatures at the lower confidence limit of the mean using a significance level of 5% (Tlcl) according to Equation (2) and Figure S14d (Figures S13 and S14 are shown in the Supplemental Material).
Figure 11. Maximum tissue temperature as a function of synchronously measured skin surface temperature (a) and maximum temperature at the skin surface during wIRA-irradiation (b). Diamonds: piglets 2–5, exposed to 126.5 mW cm−2 (IR-A); triangles: piglets 6–9, exposed to 103.2 mW cm−2; dots: piglets 10–12, exposed to 85.0 mW cm−2. Piglets p2 and p5 showed maximum tissue temperatures above 45 °C.
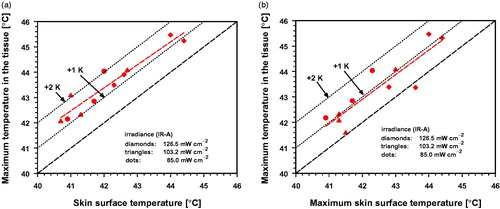
Table 6. Exposure times for different wIRA irradiances (IR-A) to reach target temperatures between 39 °C and 43 °C at the skin surface (depth = 0 mm), in the skin at a depth of 4 mm, at the lower part of the fat layer at 10 mm and in the muscle at depths of 16 and 20 mm.
Table 7. a*-data before (t = t0), immediately after wIRA-irradiation (t = te) and after the cooling-down period (tc), duration of the cooling-down period (Δtc = tc − te).