
Figures & data
Table 1. Phantom recipe without altering optical properties (1 L).
Figure 1. Apparatus used to quantify Phantoms were cast in 70 mm x 70 mm x 40 mm thin-walled (1 mm) containers with holes for the source and dosimetry probes. During testing, the container holding the phantom is placed in the measurement chamber before inserting the probes.
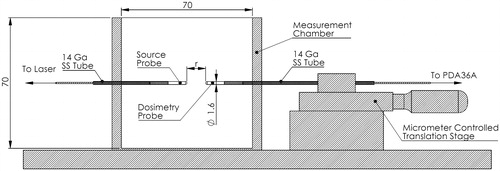
Figure 2. (A) Clinical setup during MR-US fusion guided LITT for the treatment of prostate cancer. LITT was performed in the region of interest (ROI) for 3 min. at 13.75 W with a 980 nm laser. A thermal probe was used to record temperature. (B) Experimental setup mimicking clinical conditions. The phantom was heated to 37 °C in a water bath prior to being placed in the insulated box. LITT was performed using the same equipment and configuration used clinically.
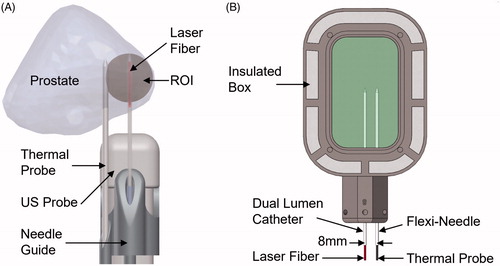
Figure 3. The effect of photobleaching in Naphthol Green B/water solutions at 980 nm. No change was observed as a result of laser exposure.
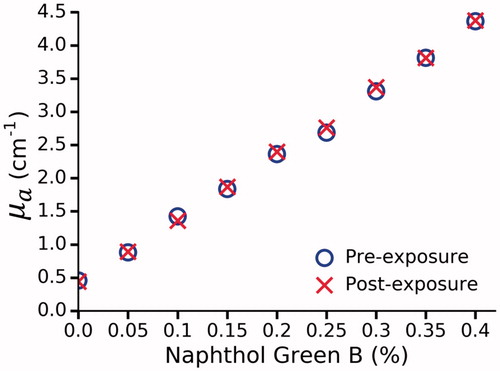
Figure 4. µa as function of Naphthol Green B concentration at 980 nm in polyacrylamide gel. µa was determined by a spectrophotometer at 24, 48 and 72 h. No further bleaching was observed after 48 h. By interpolation (dashed black line), a 0.144% concentration of Naphthol Green B was found to provide the desired µa of 0.66 ± 0.06 cm−1.
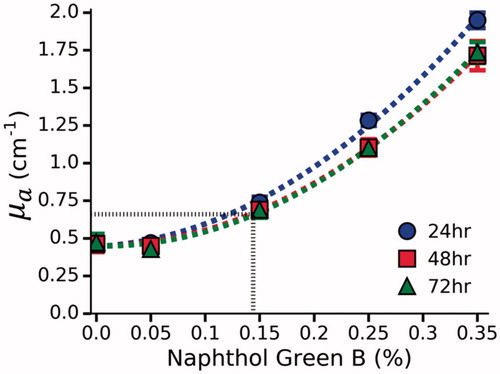
Figure 5. (A) Normalized vs r for a single set of phantoms doped with 12.5%, 25% and 37.5% BSA and 0.144% Naphthol Green B. (B) The effect of BSA concentration on
before and after coagulation measured in 3 sets of phantoms. Given the desired coagulation-induced change in
of 8.1 cm−1, the requisite concentration of BSA was found to be 31.4%. Error bars represent one standard deviation and are not visible at all points.
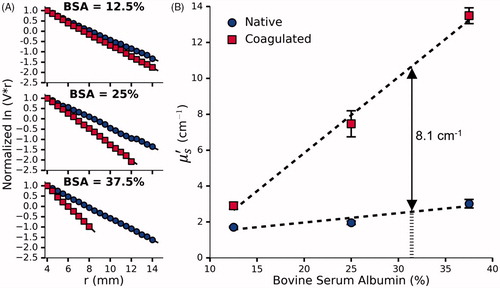
Figure 6. (A) Normalized vs r for a single set of phantoms doped with 0%, 5% and 10% Intralipid, 0.144% Naphthol Green B and 31.4% BSA. (B) The effect of Intralipid and BSA concentration on
before and after coagulation measured in 3 sets of phantoms. By interpolation, the requisite concentration of Intralipid was found to be 8.06%. Error bars represent one standard deviation and are not visible at all points.
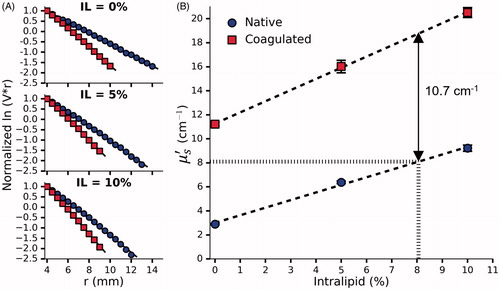
Figure 7. Normalized ln(V.r) vs r for a single optimized phantom before and after coagulation. A total of five phantoms were tested and one standard deviation was used to quantify the uncertainty in the measured optical properties shown in .
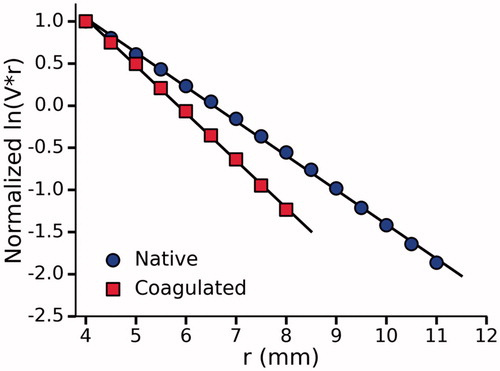
Table 2. Tissue-mimicking phantom recipe (1 L).
Table 3. Optical properties of tissue-mimicking phantom.
Figure 8. Temperature at a radial distance of 8 mm from the laser as measured in a patient and three phantoms. Dashed black line indicates laser deactivation.
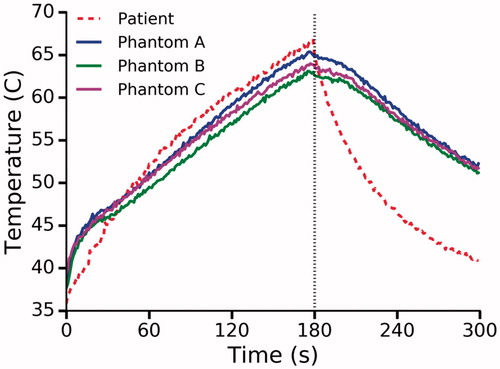
Figure 9. Absolute temperature (°C) during LITT of the optimized phantom as determined by MRT at 0 (A), 90 (B) and 180 (C) seconds after laser activation. The location of the laser fiber (dashed red line) and thermal probe (dashed black line) are marked.
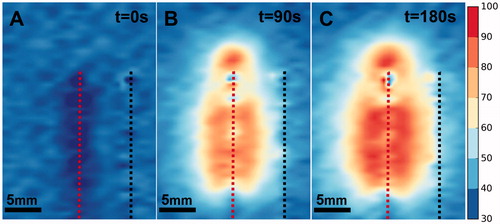
Figure 10. (A) Zone of coagulative necrosis in a patient as indicated by non-perfused tissue. The scan was acquired immediately after the patient received LITT for 3 min. at 13.75 W. Further information can be found in Natarajan et al. [Citation1]. (B) Phantom coagulation zone under T2-weighted MRI showing major and minor axes (white arrows). Note that the catheters in the center and on the right contain the laser fiber and thermal probe respectively. (C) Phantom coagulation zone under direct visualization showing major and minor axes (white arrows). Note the needle tracks in the center and to the right.
![Figure 10. (A) Zone of coagulative necrosis in a patient as indicated by non-perfused tissue. The scan was acquired immediately after the patient received LITT for 3 min. at 13.75 W. Further information can be found in Natarajan et al. [Citation1]. (B) Phantom coagulation zone under T2-weighted MRI showing major and minor axes (white arrows). Note that the catheters in the center and on the right contain the laser fiber and thermal probe respectively. (C) Phantom coagulation zone under direct visualization showing major and minor axes (white arrows). Note the needle tracks in the center and to the right.](/cms/asset/eb8c16a5-9eed-4696-b975-73e3c7880a2c/ihyt_a_1660811_f0010_c.jpg)