
Figures & data
Figure 1. MRSA (A) and MPO (B) concentrations in MRgHIFU-treated or control abscesses excised one to four days post-treatment.
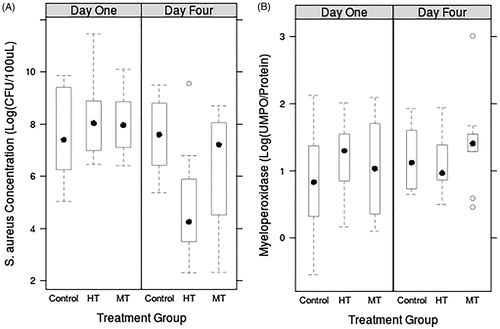
Table 1. Inclusion and exclusion criteria.
Figure 2. Patient positioning for treatment of osteomyelitis in the foot region using an MRgFUS system. “F” and “A” denote, respectively, foot and anterior directions.
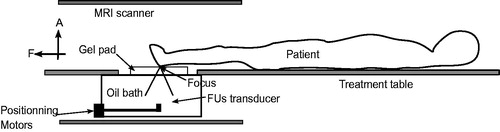
Figure 3. Flowchart to import any diagnostic MRI/CT imaging set into treatment planning software for MRgFUS therapy.
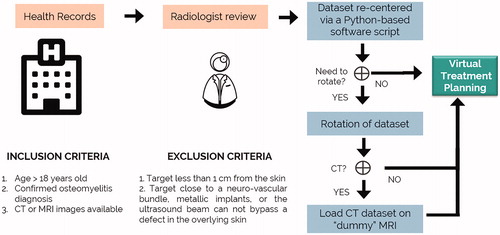
Figure 4. Flowchart to import multiple MRI/CT imaging series from the same patient into treatment planning software for MRgFUS therapy.
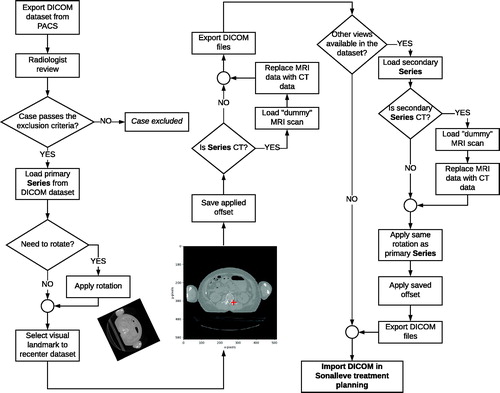
Table 2. Recruitment demographics.
Figure 5. Total lesion volume in ml versus average targetability. Although a trend is present, no statistical significance was found among those groups.
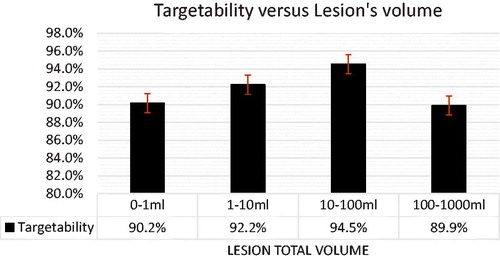
Figure 6. Case 15: MR image of a foot case with patient re-positioned to have the foot standing on the MRI table. The osteomyelitis site volume was 0.5454 ml, with a treated volume estimated at 0.50 ml by the planning software (91.7% coverage). The region in blue indicates the region attainable by the MRgFUS device. The focused ultrasound “acoustic beam” is delineated in yellow. The region in purple highlights the planning treatment volume.
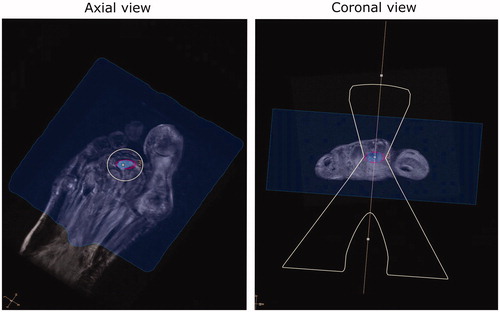
Figure 7. Case 20: MR image of a foot case with patient re-positioned from supine to prone. The osteomyelitis site volume was 13.4626 ml with a treated volume estimated at 13.41 ml by the planning software (99.61% coverage).
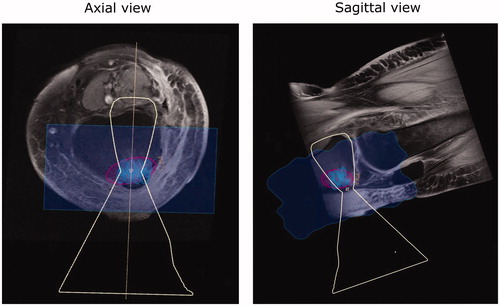
Figure 8. Case 5: MR image of a pelvis case with patient re-positioned from supine to decubitus. The osteomyelitis site volume was 123.58 m with a treated volume estimated at 106.25 ml by the planning software (86% coverage).
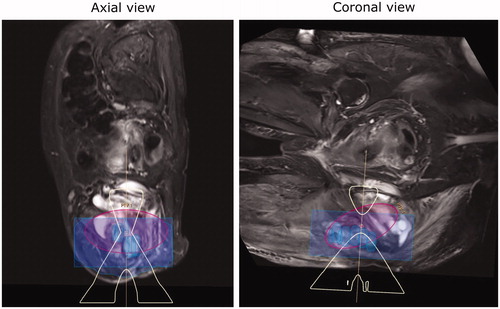
Table 3. Virtual treatment planning time per lesion total volume groups.