
Figures & data
Figure 1. PRISMA flow diagram of the literature search [Citation24].
![Figure 1. PRISMA flow diagram of the literature search [Citation24].](/cms/asset/43ebd610-9895-4e6e-b3dd-79f75e3bf65d/ihyt_a_1665718_f0001_c.jpg)
Table 1. Salient features and results of the assessment on the risk of bias [Citation26] of the 22 articles, pertaining to 25 individual studies that have been included in the systematic review.
Table 2. The location of temperature sensors (skin and/or invasively) used for calculation of a thermal dose parameter influences the relationship of the parameter with outcome.
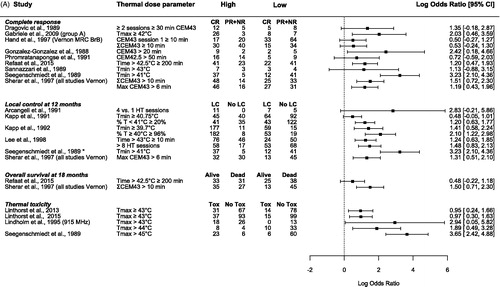

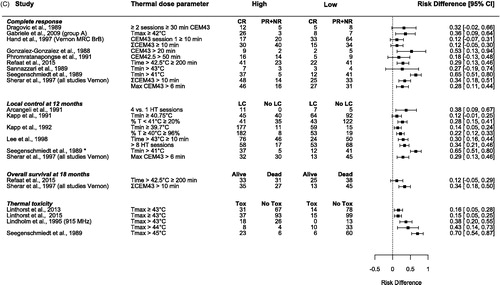
Figure 3. The number of studies where a high-end, mean, or low-end thermal parameter (T), thermal dose parameter (TD) or number of hyperthermia treatments (#HT tr), is reported in relation to complete response, duration of local control, overall survival and thermal toxicity. The univariate or multivariate relationship of the thermal dose parameters with one of the outcome measures is labeled as either a significant relationship (p < .05) a trend (p values between .05 and .1), no relationship (p ≥ .1) or as not done or not reported. The labels inside the bars represent the number of studies.
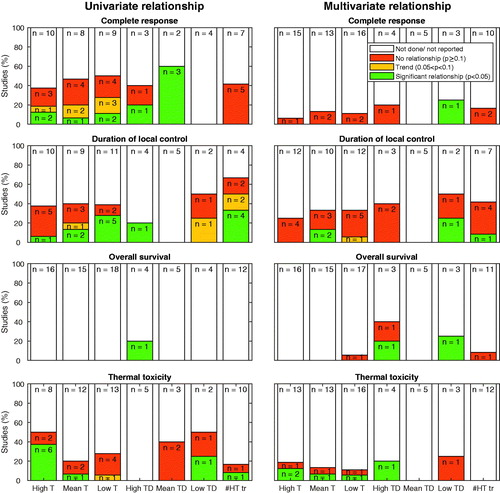
Figure 4. The relationship between tumor response and thermal dose below/above certain cutoff values (noted between the brackets) [Citation4,Citation15,Citation28–34].
![Figure 4. The relationship between tumor response and thermal dose below/above certain cutoff values (noted between the brackets) [Citation4,Citation15,Citation28–34].](/cms/asset/b353e6fc-c269-43bb-92fd-10a1d56caadb/ihyt_a_1665718_f0004_c.jpg)
Figure 5. The incidence of thermal toxicity (blisters) increases with a higher maximum skin temperature. Data was adapted from Lindholm et al. [Citation39], Linthorst et al. [Citation41], and Linthorst et al. [Citation40] combined with probability models for thermal toxicity for scar and skin tissue [Citation48].
![Figure 5. The incidence of thermal toxicity (blisters) increases with a higher maximum skin temperature. Data was adapted from Lindholm et al. [Citation39], Linthorst et al. [Citation41], and Linthorst et al. [Citation40] combined with probability models for thermal toxicity for scar and skin tissue [Citation48].](/cms/asset/f7692099-328c-43d2-9a59-660f2e15e3bf/ihyt_a_1665718_f0005_c.jpg)