
Figures & data
Table 1. Summary of features for patients and tumors treated with cryoablation.
Figure 1. (A) Axial contrast-enhanced computed tomography (CT) images. Exophytic T1b renal tumor on middle third of the right native kidney (blue arrows). (B) Coronal computed tomography images during the ablation, using 5 cryoprobes, after hydro-displacement (white star). (C) Axial T2 at 1-month follow-up shows the ablation zone (white arrows). (D) Axial T1FS after injection shows no evidence of tumoral residue.
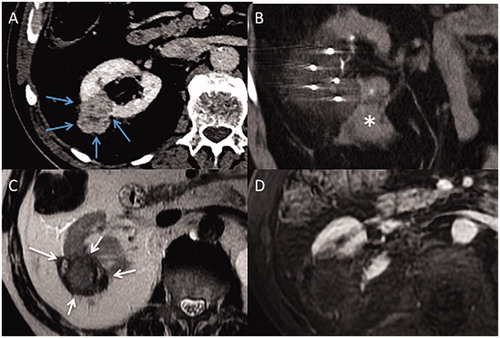
Figure 2. (A) Axial contrast-enhanced computed tomography (CT) image of a T1b renal tumor (maximum diameter: 45 cm) of lower pole of the right native kidney (white arrows) (B) Coronal contrast-enhanced computed image shows close contact between the tumor and renal sinus (grey arrows). (C) Incremental axial CT image during the procedure shows hydro-dissection to space out bowel and kidney (star). (D) Incremental coronal CT image shows a residual tumor at sinus contact (blue arrows), with margins <5 mm, and a 15 mm-gap between each four cryoprobes (double-headed arrows).
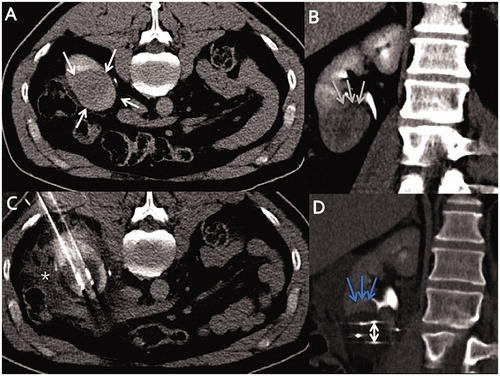
Figure 3. Axial contrast-enhanced computed tomography (CT) images. (A) T1b renal tumor (maximum diameter: 65 cm) on upper pole of the left atrophic native kidney (blue arrows), using seven cryoprobes under CT guidance. Incremental axial (B) and coronal (C) CT images during the procedure show 15 mm spacing between each probe (double-headed arrows). (D) Arterial axial contrast-enhanced CT image shows a LTP at 3 months (white arrows). (E) Axial contrast-enhanced CT shows no macroscopic residue at 3 months after a repeat cryoablation (black arrows).
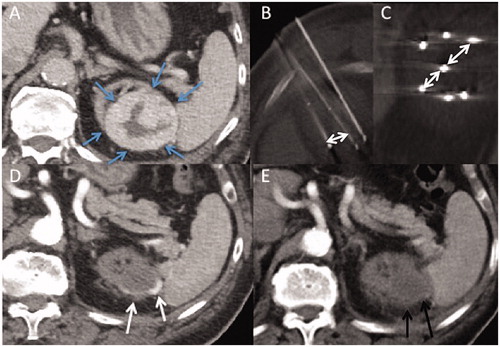
Figure 4. Kaplan–Meier survival curves for patients with stage T1b renal cell carcinoma treated with cryoablation. (A) Progression-free survival excluding secondary technique efficacy (B) Progression free-survival including secondary technique efficacy (C) Cancer-specific survival.
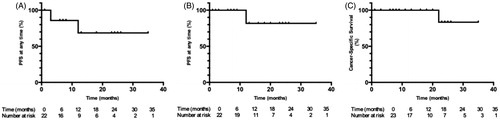
Table 2. Tested variables to predict LTP at any time.