
Figures & data
Figure 1. MR planning images in the phantom study, where the motion platform was used to simulate the breathing artifacts during MR temperature mapping. Four optical sensors were inserted in the phantom for temperature monitoring. Bar = 5 cm.
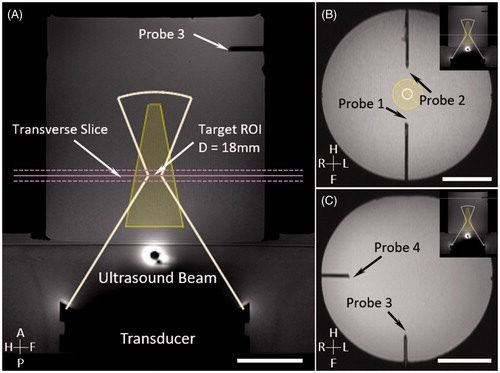
Figure 2. Experimental setup for phantom motion study. An MRI-compatible motion platform was used to create one-dimensional motion to simulate breathing artifacts during hyperthermia treatment. An aluminium disk was taped at the end of a plastic rod to introduce temperature artifacts (A). Reference images (1) for temperature mapping were acquired prior to the treatment with motion being held. HIFU started during first breath hold (2). Artifacts on temperature map were observed (3) when sinusoidal motion was introduced; HIFU was disabled during this period. Treatment resumed when motion was paused with HIFU enabled (4).
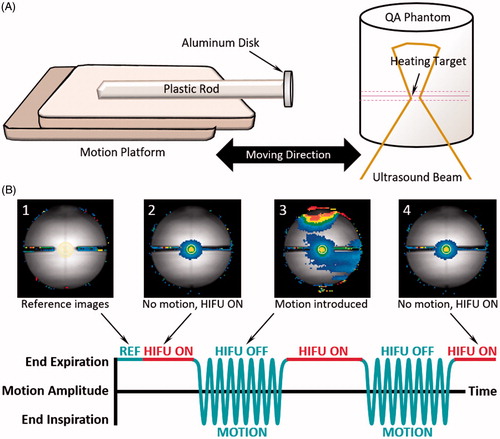
Figure 3. Evaluation of MR thermometry quality in children with tumours in different locations (with/without sedation). Cluster of points represent the mean temperature error (compared with baseline at body temperature) within a target ROI at different time points during the 5 minutes of imaging. The accuracy of MR thermometry was estimated by calculating the mean value of each cluster. The distribution of the points in each cluster indicated the temporal stability of MR thermometry.
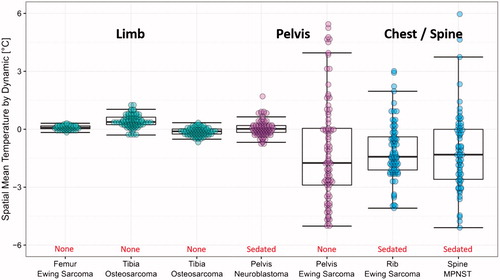
Table 1. Evaluation of MR thermometry quality in patients with solid tumors in various locations.
Figure 4. Temperature measured with MR thermometry and optical temperature probes in the phantom motion study, with HIFU enabled (A) and disabled (B). In both cases, the absolute error was significantly reduced when there was no motion present. The insert shows the probe location and the analysed ROI in MR thermometry.
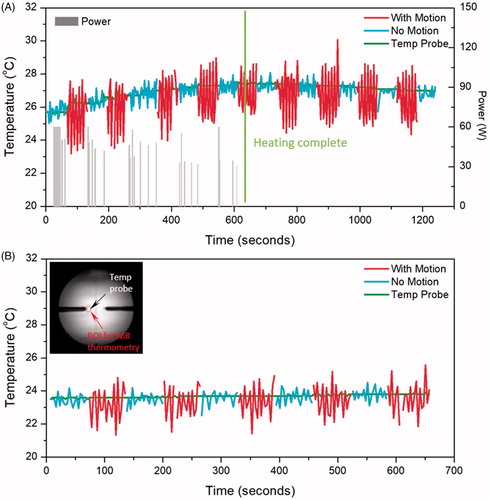
Table 2. Absolute error and stability of MR thermometry measured with and without motion in phantoms and in in vivo pig back muscle.
Figure 5. Temperature measured with MR thermometry and an optical temperature probe in the pig study when HIFU is enabled (A) and disabled (B). In both cases, the absolute error was significantly reduced when there was no motion present. The insert shows the probe location and the analysed ROI in MR thermometry.
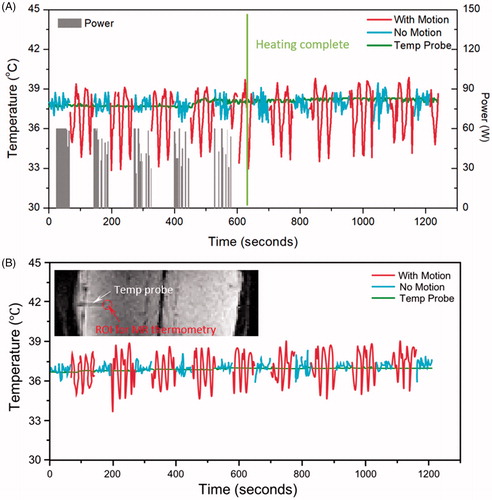
Figure 6. The breath-hold sessions during in vivo 10 minutes hyperthermia treatment (A, black arrows) and the MR thermometry absolute error for each session (B). The error changed as a function of time with bars represent mean ± SEM across all experiments (n = 6 for phantom, n = 12 for in vivo). The graph suggests the absolute error tends to increase over time and the change was more pronounced in the pig study than that in phantom.
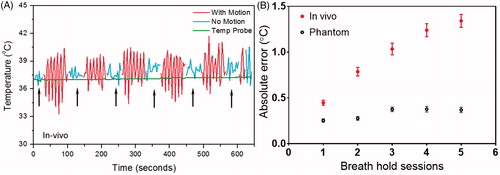
Figure 7. In vivo mild hyperthermia treatment in a pig. Treatment planning image (A) and heating pattern (B) indicate effective hyperthermia treatment within target region (black contour shows 42 °C isotherm). Bar = 5 cm. Temperature curve (C) indicates that mild heating (41–45 °C) within target region was achieved for 10.0 minutes, confirming the feasibility of breath-hold mild hyperthermia treatment. Gray bars indicate the power level during the treatment, and green curve indicates a stable body temperature measured using invasive probe.
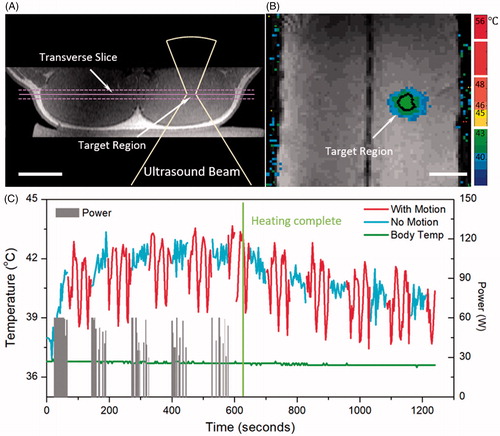
Figure 8. The fitting curve for heating and cooling period in phantom and pig experiment. The black thick line is the overall fitting curve across all datasets, whereas the thin colored curves are raw temperature measurements from MR thermometry. A, B and C, D are for heating and cooling period respectively. The fitting coefficients were acquired based on the accurate temperature measurements during breath hold.
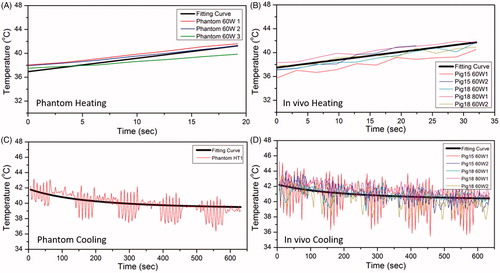
Figure 9. Shows the time in range (TIR) estimates based on various combinations of breath-hold and free breathing periods. Panel A shows examples of the heating profile in time for different combinations. At a fixed free-breathing period, shorter breath-hold period generated less heating effect and shorter TIR (first and second row). On the other hand, with a fixed breath-hold period, longer free-breathing period resulted in a shorter TIR (first and third row). Panel B depicts a contour map of TIR for various combinations of breath hold and free breathing duration for a 10-minutes hyperthermia treatment. Contour lines indicate the suggested combination to achieve a TIR of 7, 8, and 9 minutes, respectively.
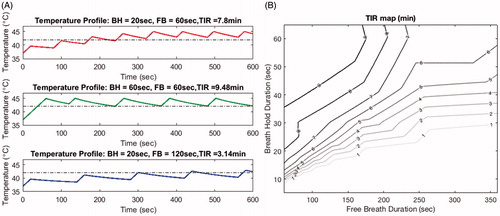
Table 3. Comparison of the accuracy and stability of MR thermometry evaluated in this study with other references (A) and the estimated diffusivity generated with our model compared with other studies (B).