
Figures & data
Figure 1. Results of initial chart review.
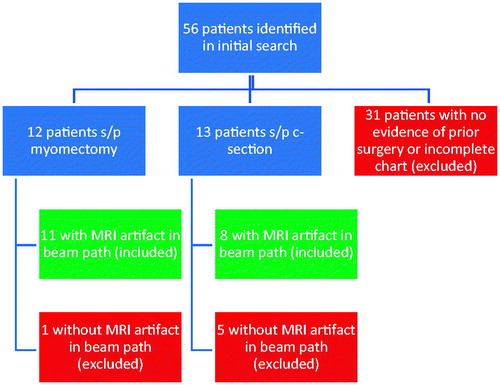
Figure 2. Sagittal (A) and Axial (B) post contrast post MRgFUS treatment scans with severe myomectomy artifacts (arrows) that manifest as areas of signal void. Note multiple non-enhancing necrotic fibroids.
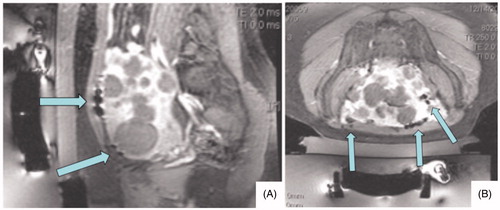
Figure 3. Sagittal (A) and coronal (B) post contrast post MRgFUS treatment images show moderate artifacts (arrows). Although the patient has several artifacts, they are small and most are visible only in the coronal plane.
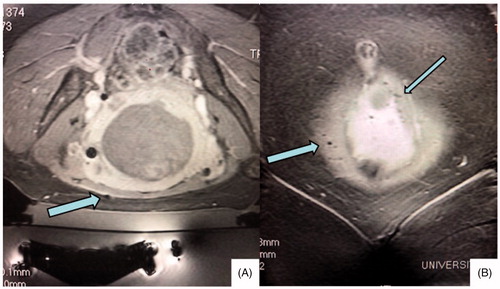
Table 1. Characteristics of included patients. 36 individual fibroids were treated in the 19 patients included in the analysis.
Table 2. Treatment efficacy for individual fibroids in patients with mild, moderate and severe artifact visible on T1 weighted post contrast fat saturation images.
Figure 5. Axial T1 SPGR image (A) shows mild artifact (arrow) along abdominal wall with no metal on axial CT slice (B). Sagittal post contrast post MRgFUS treatment image from the same patient (C) shows artifacts along beam path (arrows).
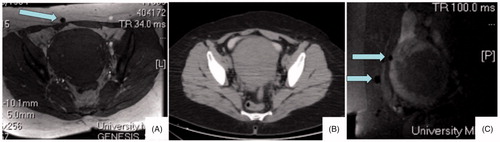
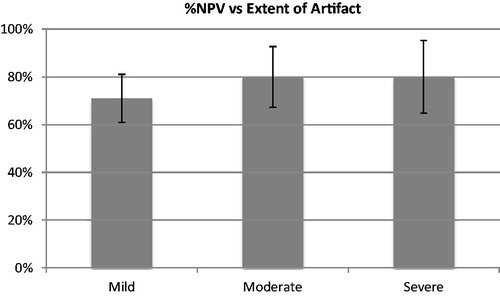
Figure 4. Average percent non-perfused volume (%NPV) of fibroids after treatment for patients with mild, moderate and severe artifact visible on T2 weighted pretreatment MRI.
Data availability
The data that support the findings of this study are available from the corresponding author, VS, upon reasonable request.