
Figures & data
Figure 1. Diagram of the patient selection process.
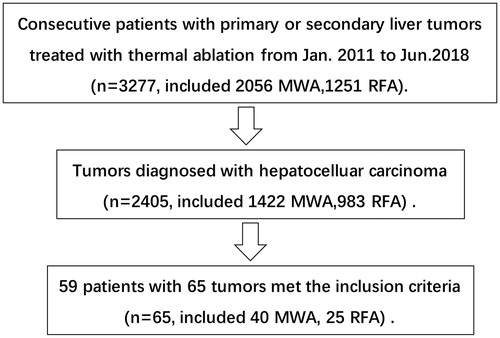
Table 1. Baseline characteristics of patients and tumor.
Figure 2. Contrast-enhanced magnetic resonance imaging (MRI) of a 58-year-old male patient diagnosed with a single HCC lesion (3.7 cm × 3.2 cm) adjacent to the second porta hepatis (arrow). The mass showed markedly high signal T2-weighted images (a) and low signal on transverse and coronal MRI in the hepatobiliary phase (b,c). (d) He underwent CT-guided multiple-site MWA in the supine position with the output of 70 W for 20 min in total. A month after the ablation, MRI results (e,f) showed that the lesion was completely necrotic without any enhancement.
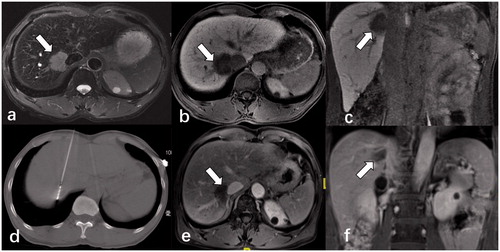
Figure 3. (a) The median LPFS was 37.4 months. The 1-, 2-, and 3-year LPFS rates were 86.2%, 66.5%, and 66.5%, respectively. (b) The median PFS was 11.0 months. The 1-, 2-, and 3-year PFS rates were 47.9%, 27.0%, and 20.2%, respectively.
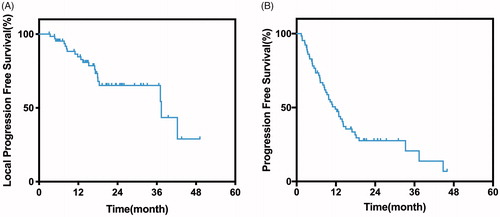
Figure 4. (a) Kaplan–Meier curves of LPFS in patients with tumor smaller than 3 cm (n =47; median LPFS: 42.3 months) or larger than 3 cm (n =18; median LPFS, 18.0 months; P =.007). (b) Kaplan–Meier curves of LPFS in patients with whose distance between tumor and IVC is larger than 5 mm (n =41; median LPFS: 42.3 months) or larger than 5 mm (n =24; median LPFS, 18.4 months; P =.018).
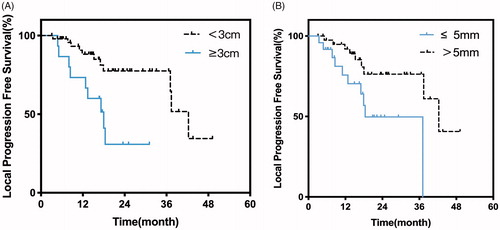
Table 2. Univariate analysis of the risk factors of local progression-free survival.
Table 3. Multivariate analysis of the risk factors of local progression-free survival.
Table 4. Incidence of complications related to ablation.