
Figures & data
Figure 1. Flow chart shows patient selection criteria. iPTH: intact PTH. The indicated inclusion criteria (a)–(h) were described in the main text.
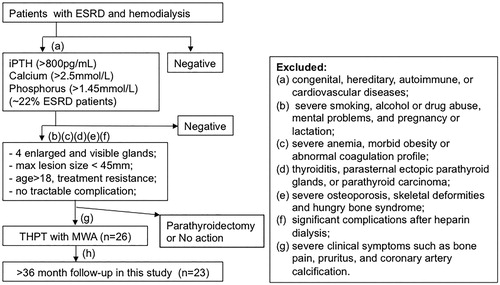
Table 1. Clinical characteristics of patients with THPT.
Figure 2. Ultrasound characteristics of a patient (female, 27 years old, on hemodialysis for 8 years) before and after microwave ablation (MWA). (A–C) Images of the upper and lower nodules (arrows) on the right side by two-dimensional ultrasound (A) and contrast-enhanced ultrasound (CEUS) (B) and the blood flow by color Doppler flow imaging (CDFI) (C) before MWA. (D) Saline injection into the parathyroid capsule for heat insulation. Arrow shows the separating saline interface. (E) Image of the MWA of the upper nodule. The antenna and ablating tip are shown by arrow and star, respectively. The ablation zone was evaluated through echo changes from the position of the antenna tip. (F–G) Images of the upper nodule after MWA by CDFI (F) and CEUS (G).
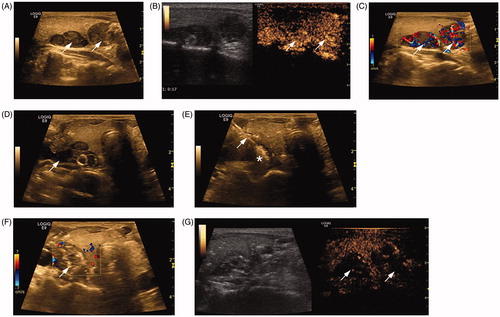
Figure 3. Ultrasound characteristics of the patient in after microwave ablation (MWA). Images of the upper and lower nodules on the right side and the blood flow by color Doppler flow imaging at 1-month (A) and 36-month (B) follow-up.
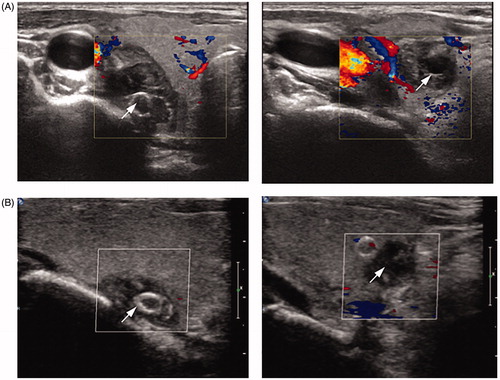
Figure 4. Time course of laboratory clinical data before and after microwave ablation (MWA). Serum levels of intact parathyroid hormone (iPTH) (A), calcium (B), phosphorus (C), and alkaline phosphatase (ALP) (D) before MWA and at 1 day, 1 week, 1 month, 3 months, 6 months, 12 months, 24 months, and 36 months after MWA. Statistics by paired t-test. p < 0.001.
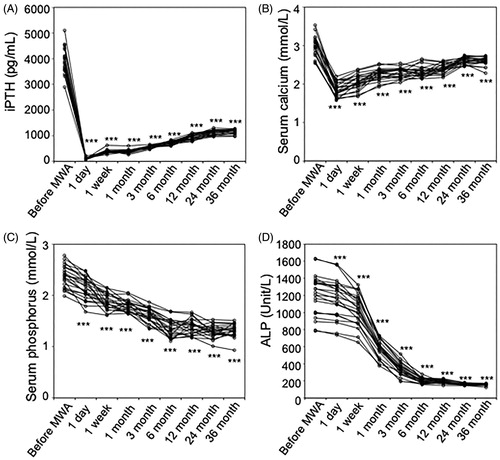
Table 2. Laboratory clinic data before and after MWA.