
Figures & data
Figure 1. Coronal maximum intensity projection [Citation19] (left) and cross-sectional view of the arteries [Citation21] (right) illustrating arterial locations where imaging data were acquired and quantified. Schematic of protocol timeline (bottom).
![Figure 1. Coronal maximum intensity projection [Citation19] (left) and cross-sectional view of the arteries [Citation21] (right) illustrating arterial locations where imaging data were acquired and quantified. Schematic of protocol timeline (bottom).](/cms/asset/6ed6e5cc-e0ee-45c8-8385-811e87831981/ihyt_a_1684577_f0001_b.jpg)
Table 1. Summary of main findings of arterial vascular response to adrenergic and thermal stress by in vivo MRI investigation.
Figure 2. Cross-sectional area across the cardiac cycle for the (A) carotid artery, (B) suprarenal aorta, and (C) iliac artery at 35 and 38 °C (left and right) for baseline and dobutamine (n = 8 adult male mice). For the hypothermic condition (35 °C), area (avg: average, min: minimum/end-diastolic and max: maximum/peak-systolic) decreased with dobutamine for the suprarenal aorta (*). For the hyperthermic condition (38 °C), area decreased with dobutamine for the carotid (avg, min and max), suprarenal aorta (avg, min and max) and iliac artery (min). Diastolic peak at fraction of cardiac ∼1. Images are acquired for over one complete cardiac cycle to insure MRI data accurately captures systole and diastole. Error bars omitted for clarity.
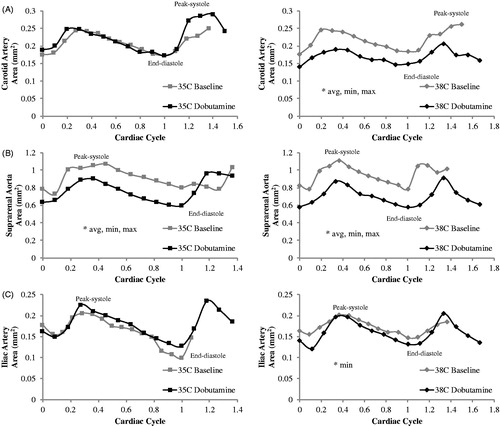
Figure 3. Maximum cyclic strain across the cardiac cycle for suprarenal aorta (left) and iliac artery (right) at baseline and dobutamine for two core body temperatures 35 and 38 °C (n = 8 adult male mice). Strain increases from baseline to dobutamine for the iliac at 35 °C and both vessels at 38 °C. Significance set at p < .05. Comparing baseline to dobutamine at a given location and temperature (*).
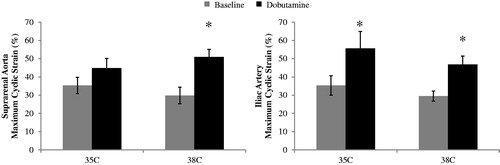
Figure 4. The response to dobutamine (dobutamine – baseline) for average, minimum and maximum areas at 35 °C (left) and 38 °C (right) (n = 8 adult male mice). Comparing response between 35 and 38 °C at a given location, e.g., compare response at 35 to response at 38 for the suprarenal aorta (Δ). For a given temperature, the three responses at all other locations were significantly different from the corresponding values at the suprarenal aorta (#). Significance set at p < .05.
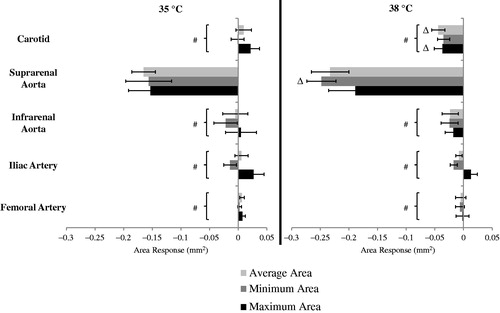
Figure 5. The response to dobutamine (dobutamine – baseline) for maximum cyclic strain at 35 and 38 °C (n = 8 adult male mice). Strain tended to increase from baseline to dobutamine. Comparing response between 35 and 38 °C at a given location (NS); comparing response at 35 or 38 °C between locations (NS). Significance set at p<.05. NS: not significant.
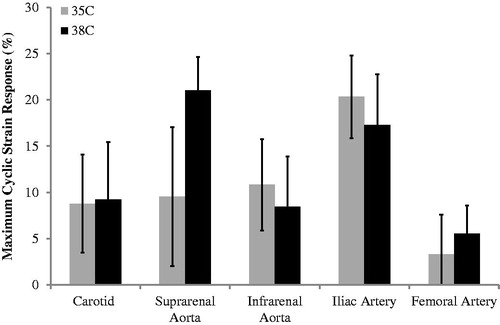
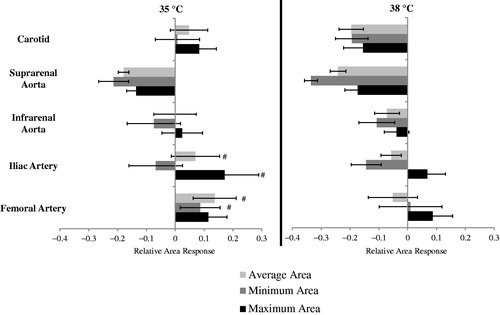
Figure 6. The relative response to dobutamine for average, minimum and maximum areas at 35 °C (left) and 38 °C (right) (n = 8 adult male mice). For a given temperature, comparing the relative response of the suprarenal aorta to corresponding values at other locations (#). Significance set at p<.05.
Availability of data and material
The datasets used and/or analyzed during this study are available from the corresponding author upon reasonable request.