
Figures & data
Figure 1. (A) Illustration of the experimental setup showing the animal’s position, MR thermometry slices, locations of MR coils, gel pad, and treatment organs. Stars indicate the three target areas: MVB (muscle adjacent to the ventral bladder wall), MDB (muscle adjacent to the dorsal bladder wall), and uterus. (B) Coronal slice of the MR images overlays with the schematic illustration of the beam path and the transducer in a HT session in the treatment of the uterus as an example.
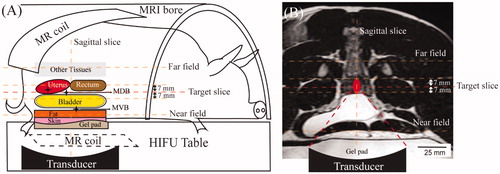
Figure 2. (A) Illustration of the target region-of-interest selection indicated by the red circle on the axial MRIs (target slice) for three different treatment locations. From left to right: muscle adjacent to the ventral wall of the urinary bladder (MVB), muscle adjacent to the dorsal wall of the urinary bladder (MDB), and the uterus. (B) The representative average temperature map of the axial plane (target slice) of the three pelvic targets. (C) The representative average temperature (Tavg), maximum temperature (Tmax), and minimum temperature (Tmin) during the 30-min HT session and the 5-min cooling periods.
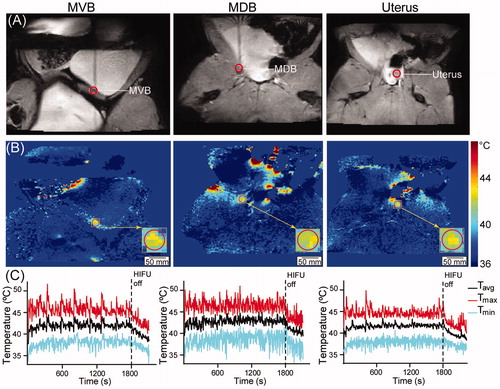
Table 1. Temperature statistics in the target region-of-interest (tROI) within the target slice and the beam cross-section in the near field.
Figure 3. Temperature metrics for the three pelvic target region-of-interests in °C. (A) Temperature accuracy. (B) Temperature precision. (C) Temporal variation. (D) Heating uniformity.
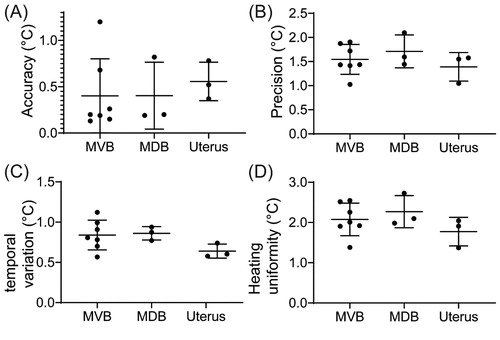
Figure 4. (A) The CEM43T90 calculated based on the temperature in each voxel within the target region-of-interest (tROI). (B) Time (s) for the average temperature of the tROI to reach 41 °C after the start of the sonication. (C) Time (s) for the average temperature of the tROI to decrease to 40 °C after the termination of the sonication.
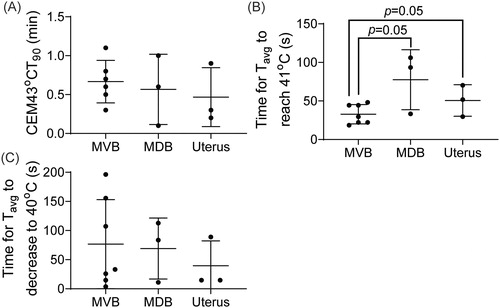
Figure 5. (A) The contrast-enhanced MRI before any intervention. (B) The contrast-enhanced MRI at the completion of the hyperthermia therapy. The yellow arrow indicates the location of the HT target. (C) The contrast-enhanced MRI right after ablation. The blue arrows indicate the location of the ablation lesions. (D) The gross pathology of the uterus after the completion of HT and ablation. The yellow arrow points to the location of the HT target. The blue arrow indicates the ablation lesions (thermal damage).
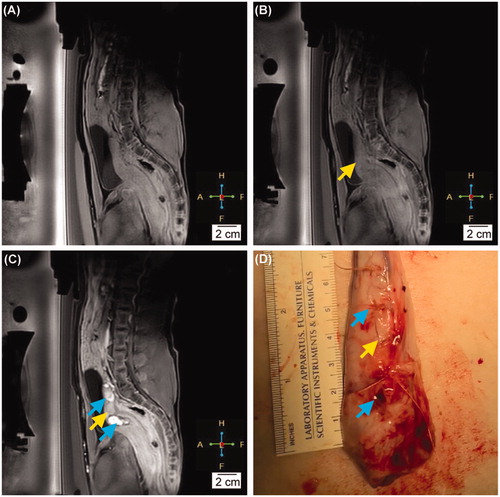
Figure 6. Representative H&E images of analyzed tissues. Columns left-to-right are tissues which received HT and/or were within ultrasound beam path, controls, and ablation targets. Rows show samples from different tissue sites: (A) muscle adjacent to the ventral wall of the urinary bladder (MVB), (B), uterus, and (C) skin and subcutaneous tissue. Yellow arrow shows congestion of the vasculature. Blue arrows show edema and the separation of the lamina propria from the epithelium.
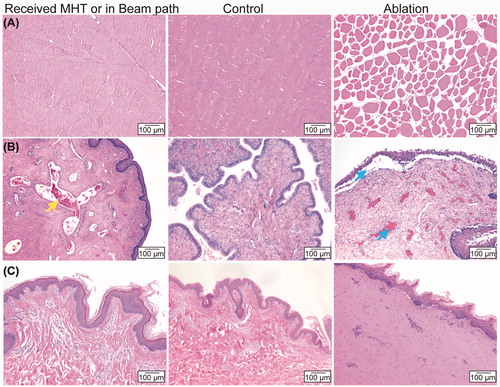
Table 2. Categorization of the post-HT histological analysis based on target locations.