Figures & data
Figure 1. Acquirement of the lateral-view side mirrors and measurement of the changes in the difference of skin temperature (DST). (A and B) The range of imaging. (C–E) The calculation of the DST. DSTaverage/max=the average/maximum temperature (treated) the average/maximum temperature (control).
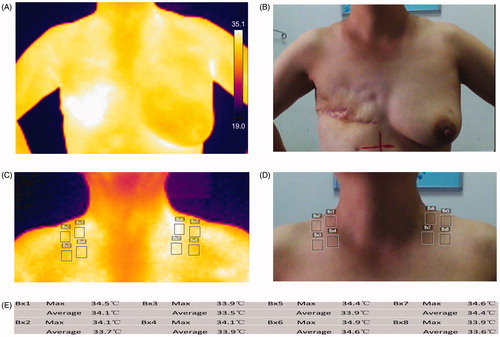
Table 1. Patient demographics and disease characteristics.
Table 2. The patient-reported symptoms and temperature changed along with time.
Figure 2. The correlation of the difference of skin temperature and dermatitis score. (A) A representative case with thermography and photograph every week. The color was a presentation of the surface temperature in thermography from 22.7 to 37.9 °C. (B) DST gradually increased with the progress of radiotherapy and peaked at the first week after the end of radiotherapy. (C) With the progress of radiotherapy, the RSI became more severe. The proportion of RSI Grade 2 was the highest at 1 week after the end of radiotherapy. Combined with the above three parts, it can be intuitively found that the severity of RSI is positively correlated with skin temperature changes.
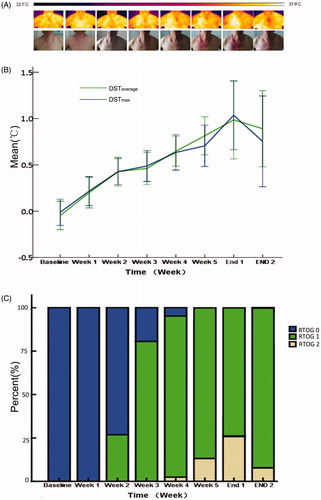
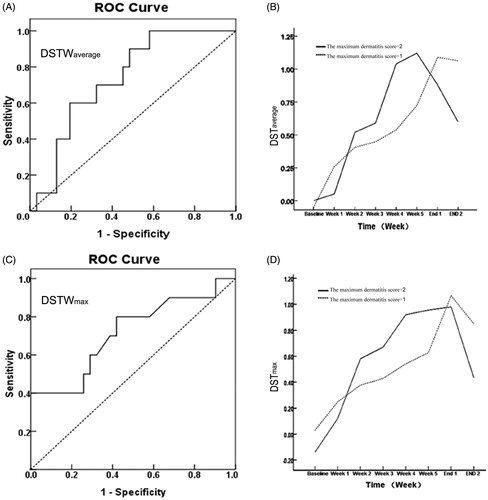
Figure 3. Receiver–operator curve of the difference in temperature as a predictor of future RSI and the tendency chart of DST according RTOG grade. (A and C) The ROC curve of DSTWaverage and DSTWmax, respectively (p = .027 and 0.044). (B and D) The change of difference in average and maximum temperature based on the maximum dermatitis score groupings (Grade 1 or Grade 2), respectively. The slope value of temperature at the second week end compared with the first week was significant increase in a higher toxicity group.