Figures & data
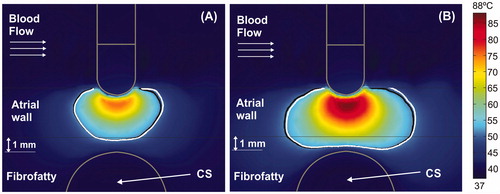
Figure 1. Anatomical context modeled in the study. Anatomical pictures (left) and histological image (right) showing the spatial relation between the catheter ablation electrode and the two epicardial vessels (left circumflex coronary artery –LCx– and coronary sinus –CS–) (reused from Damián Sánchez-Quintana et al. [Citation4], which is an open access article distributed under the Creative Commons Attribution License).
![Figure 1. Anatomical context modeled in the study. Anatomical pictures (left) and histological image (right) showing the spatial relation between the catheter ablation electrode and the two epicardial vessels (left circumflex coronary artery –LCx– and coronary sinus –CS–) (reused from Damián Sánchez-Quintana et al. [Citation4], which is an open access article distributed under the Creative Commons Attribution License).](/cms/asset/751657ed-f013-45b4-a902-398b5fe13733/ihyt_a_1686181_f0001_c.jpg)
Figure 2. Geometry of the model (out of scale, dimensions in mm). A: Front view showing the spatial distribution of the left circumflex coronary artery (LCx) and coronary sinus (CS). The dimensions of cardiac chamber X = 80 mm and Y = 40 mm (Z = Y) and connective tissue C = 23 mm were obtained from a convergence test. An irrigated multi-hole electrode (3.5 mm, 8 Fr) inserted a depth of 0.5 mm in the tissue was modeled: ThermoCool® SF (Biosense Webster, Diamond Bar, CA, USA). The dispersive electrode was modeled by an electrical boundary condition on the bottom surface of the model (thick black line). The saline irrigation through the small holes in the electrode tip was modeled by an inlet velocity boundary condition (usaline) at the electrode-blood interface. B: Side view showing how the CS goes across the model, and the occlusion balloon (length L) occupies the zone exactly under the electrode (proximal occlusion).
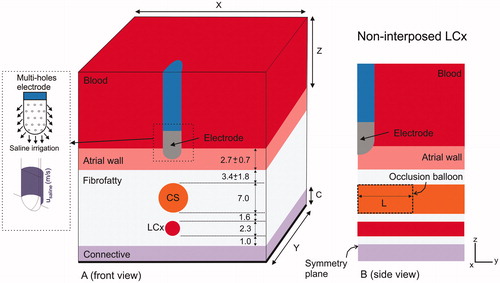
Figure 3. Temperature distributions (scale in °C) at 15 s with the electrode in perpendicular position for four arrangements: (A) typical case with 2.7 mm atrial wall (AW) and 3.4 mm distance from AW to CS (AW-CS distance); (B) 3.4 mm AW and 1.6 mm AW-CS distance; (C) 3.4 mm AW and 1 mm AW-CS distance; (D) 3.4 mm AW and 0.5 mm AW-CS distance. Lines represent the thermal lesion contours for the cases without occlusion (solid white line), with distal occlusion (solid black line), and with proximal occlusion (dashed black line), i.e., with the 40 mm balloon just below the electrode.
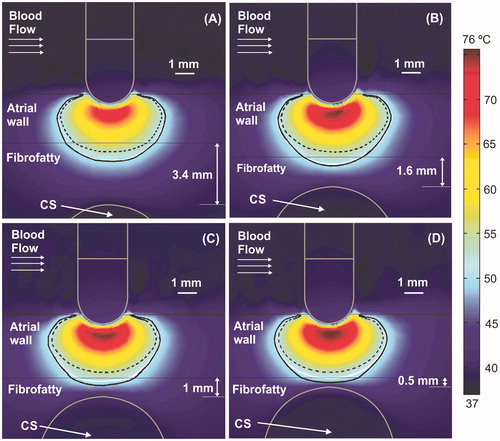
Figure 4. Temperature distributions (scale in °C) at 60 s with the electrode in perpendicular position for four arrangements: (A) typical case with 2.7 mm atrial wall (AW) and 3.4 mm distance from AW to CS (AW-CS distance); (B) 3.4 mm AW and 1.6 mm AW-CS distance; (C) 3.4 mm AW and 1 mm AW-CS distance; (D) 3.4 mm AW and 0.5 mm AW-CS distance. Lines represent the thermal lesion contours for the cases without occlusion (solid white line), with distal occlusion (solid black line), and with proximal occlusion, i.e., with the 40 mm balloon just below the electrode (dashed black line).
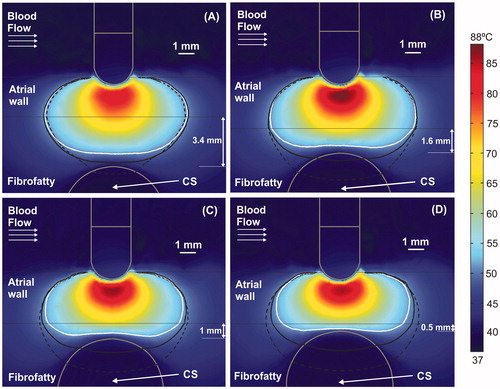
Table 1. Thermal and electrical characteristics of the elements employed in the models.
Figure 5. Temperature distributions (scale in °C) for the case of 3.4 mm atrial wall and 1 mm between atrial wall and CS, considering two electrode angular orientations with respect to the tissue: 45° at 15 s (A) and at 60 s (B); and 0° (parallel) at 15 s (C) and at 60 s (D). Lines represent the thermal lesion contours for the cases without occlusion (solid white line), with distal occlusion (solid black line), and with proximal occlusion, i.e., with the 40 mm balloon just below the electrode (dashed black line).
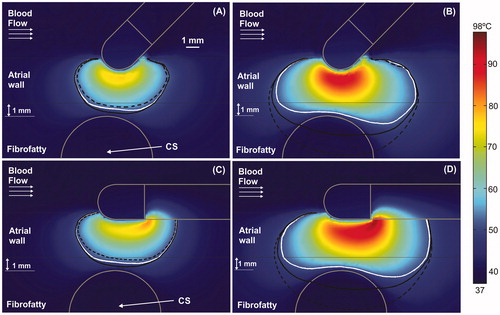
Figure 6. Current density around CS for cases without balloon (A) and with air balloon (B). Note that electrical current is drastically distorted by the presence of the balloon. The current goes through the CS in the case without a balloon, whereas it surrounds the CS when an air-filled balloon is placed inside it.
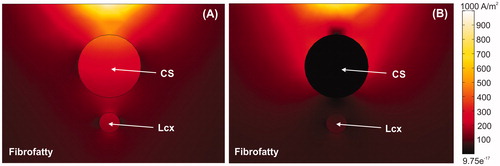
Figure 7. Temperature distributions (scale in °C) with the electrode in perpendicular position for the case of 3.4 mm atrial wall, 1 mm of AW-CS and without occlusion of CS at 15 s (A) and 60 s (B). The cardiac chamber blood flow velocity was increased from 8.5 cm/s (solid black line) to 25 cm/s (solid white line).