
Figures & data
Figure 1. CONSORT diagram showing the inclusion and exclusion criteria and the resulting eligible patients, who were separated into two groups based on the length of the electrode used to treat them.
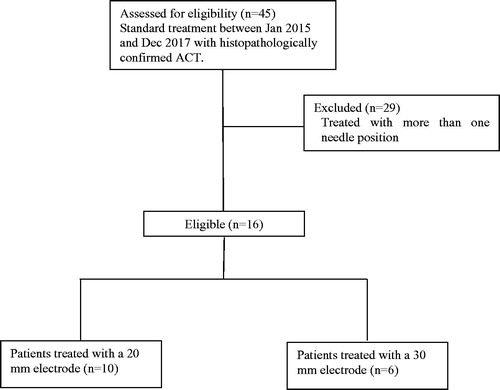
Table 1. Patients, parameters, and outcomes.
Table 2. Summary of the patients and ablations parameters.
Figure 2. (A, B) intraoperative CT and postoperative gadolinium-enhanced MR of a tumor ablated close to the cortical wall in a femur metaphysis. (C, D) intraoperative CT and postoperative gadolinium-enhanced MR images of a centrally located tumor ablated in a femur metaphysis.
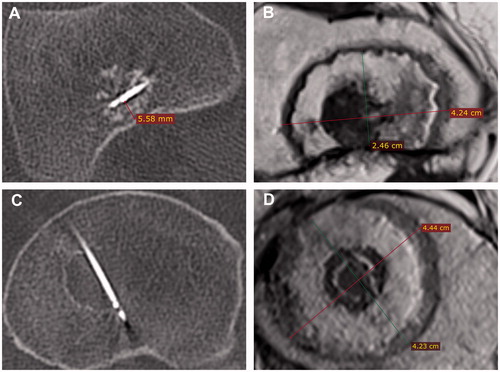
Table 3. Longitudinal and perpendicular diameters of the tumors and ablations. All measurements are in millimeters. Values with a * are normally distributed and represent thus the mean and standard deviation (SD), whereas the rest are non-normally distributed and represent the median and interquartile ranges (IQR), as indicated.
Figure 3. Tumor diameters versus resulting ablation diameters of all 16 patients. Left: longitudinal ablation and tumor diameters. Right: Perpendicular ablation and tumor diameters. The solid diagonal lines in the graphs represent the point where the size of the ablation and the tumor could be the same, indicating the potential risk of recurrence.
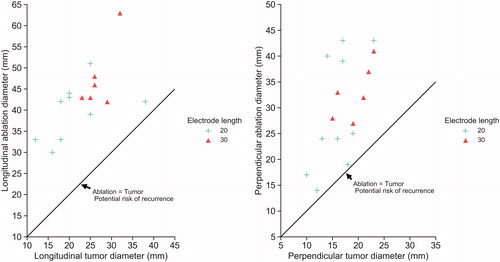
Table 4. Median, IQR, and range of the difference between the resulting ablation diameters and tumor diameters. All values are in millimeters.