Figures & data
Figure 1. Consort diagram for the study.
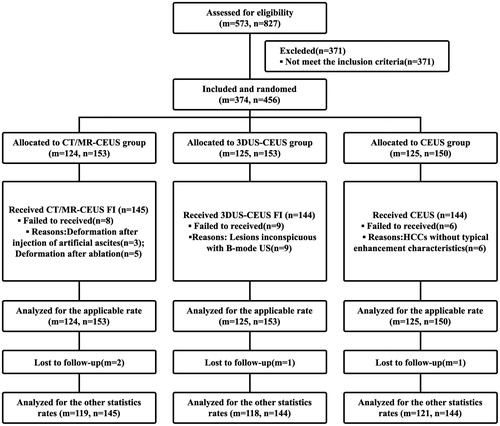
Table 1. Baseline patient and tumor characteristics.
Figure 2. Three lesions were evaluated by CT/MR-CEUS FI (a), 3DUS-CEUS FI (b) and CEUS (c) respectively, and met the requirement of complete ablation. a1, b1: The real-time US is shown at left, the pre-ablation CEMR(a1) and 3DUS(b1) images are shown at right, and the margin of lesion (blue circle) plus a 5-mm AM (red circle) were outlined. The non-perfusion area had entirely covered the lesion and 5-mmAM (red arrow), showing that the lesions were ablated completely and sufficient AM were obtained. c1: The index lesion is shown at right (blue arrow). After ablation, the non-perfusion area covered the whole lesion (red circle), showing complete ablation. a2, b2, c2: CEMR one month after ablation demonstrated the technical efficacy of the ablation (black arrow).
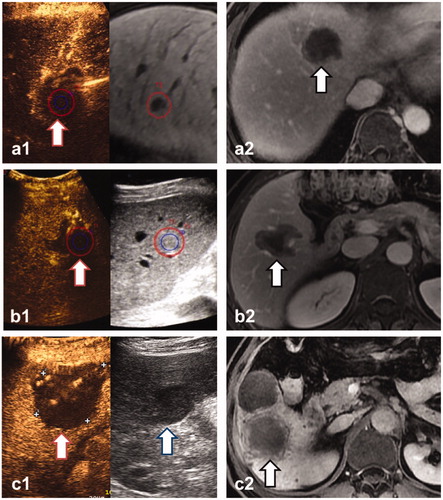
Figure 3. LTP curves among CT/MR-CEUS, 3DUS-CEUS and CEUS groups. (A) There was no significant difference among the three groups in the whole lesions (p = .105). (B and C) The results by subgroups of patients with ALBI grade 2 and 3 and tumors located at risky positions were significantly associated with higher LTP rates (p = .000, .042, respectively). (D) The results by subgroups of multiple tumors was close to 0.05 (p = .052).
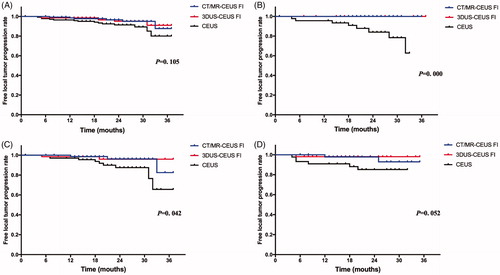
Table 2. Subgroup analysis of LTP among CT/MR-CEUS, 3DUS-CEUS and CEUS groups.
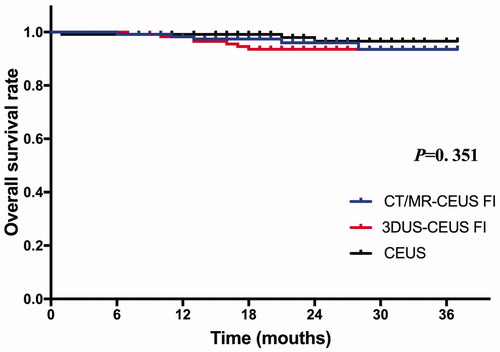
Figure 4. Overall survival curve among CT/MR-CEUS, 3DUS-CEUS and CEUS groups. There was no significant difference among the three groups (p = .351).