Figures & data
Figure 1. CONSORT flow diagram summarizes the patient enrollment process in this study.
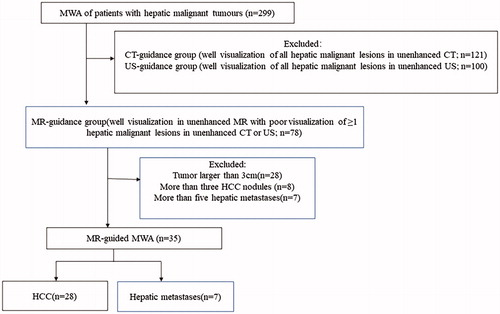
Table 1. Patient characteristics.
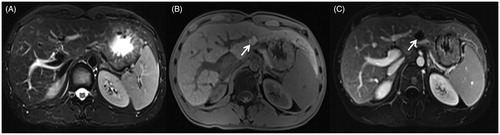
Figure 2. A 35-year-old man presented with recurrent hepatocellular carcinoma after radiofrequency ablation. (A) A nodule is seen in the left lateral lobe of the liver. The fsFRFSE T2WI sequence shows a hyperintense lesion (arrow). (B) The 3 D Dyn T1WI sequence shows a hypointense lesion.
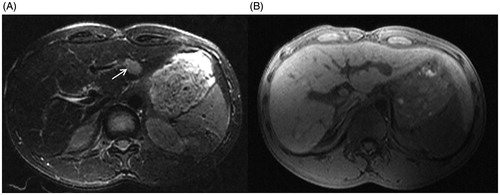
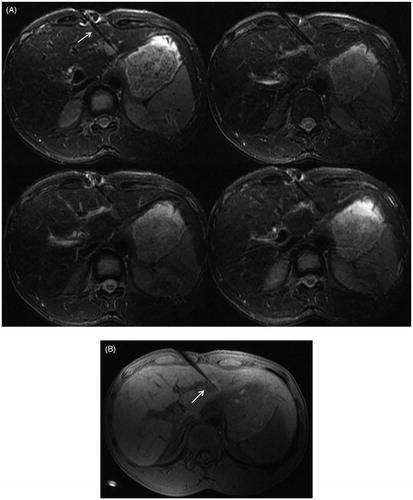
Figure 4. 11 months after MWA, the MRI of the same patient as in and . (A) The fsFRFSE T2WI demonstrated the ablated lesion was isointense. (B) The unenhanced 3 D Dyn TIWI demonstrated the ablated lesion was hyperintense (arrow). (C) The enhanced equilibrium phase MRI displayed an unenhanced ablated lesion (arrow).