Figures & data
Figure 1. Different standardized ROIs used to describe quantitative image quality. Axial slice showing the applicator and different region of interests (white circles): 1, on the marker at the distal end of the applicator; 2, on liver in extension of the applicator; 3, on liver >3 cm away from the applicator within the right liver lobe; 4, on the inferior vena cava (A); in a second slice without the applicator and without any visible artifacts, further ROIs were positioned: in the liver parenchyma and inferior vena cava (B).
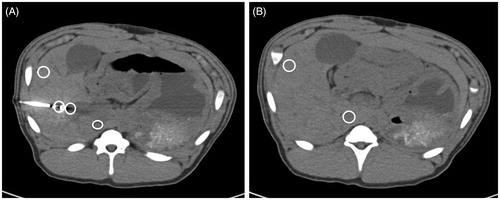
Figure 2. Degree of artifacts in liver in extension of the applicator as a parameter to describe qualitative image quality. Likert score 2, mild: artifacts leading to mild loss of visibility of liver tissue in extension of the applicator (A); Likert score 3, moderate: artifacts leading to moderate loss of visibility of liver tissue in extension of the applicator (B); Likert score 4, severe: artifacts leading to complete loss of visibility of liver tissue in extension of the applicator (C).
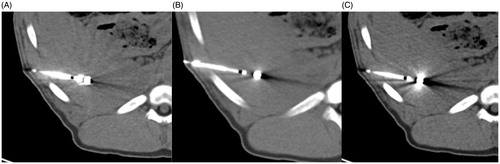
Figure 3. CT numbers for liver in extension of the antenna for different mAs. 120 kVp was used for all scans. CT numbers for FBP B30 and I30-1 were significantly lower in comparison to I30-1 with iMAR with less streak artifacts at the tip of the antenna and thus higher CT numbers. No significant differences were seen between FBP B30 and its corresponding iterative reconstruction I30-1.
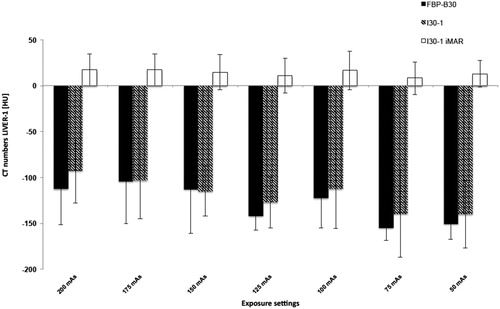
Table 1. Density measurements for 2/1 mm slices (considering the axial slice showing the antenna).
Table 2. SNR and noise.
Figure 4. SNR (A) for different dose settings. 120 kVp was used for all scans. SNR was superior for I30-1 and I30-1 iMAR compared to FBP. SNR was best for iMAR images. SNR increased with applied dose with statistical significance. Noise (B) decreased significantly with increasing radiation dose. No general significant differences were observed between FBP B30, I30-1 and I30-1 iMAR.
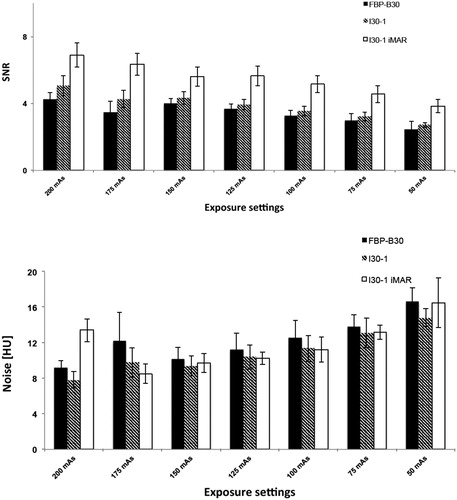
Figure 5. Representative image examples 2/1 mm slices at 200 mAs (A,B) and 50 mAs (C,D), each with FBP B30 (A,C) and I30-1 iMAR (B,D). Less streak artifacts especially in the liver parenchyma bordering to the antenna was observed for iMAR (arrow head) in comparison to FBP B30 (white arrow). More noise is noticed on images with 50 mAs (B).
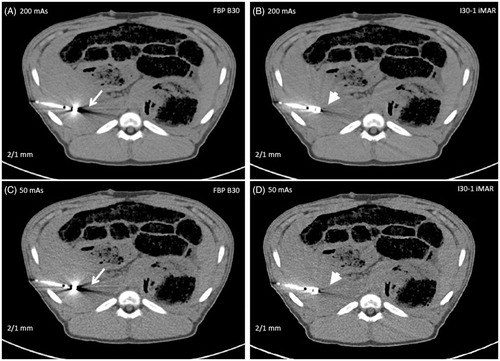
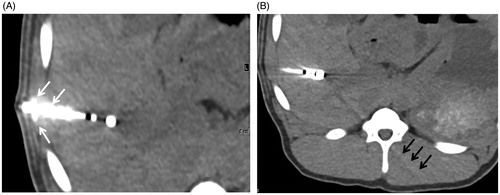
Figure 6. Image examples for new artifacts generated by iMAR: (A) Blooming artifacts especially around at the antenna (white arrows) and dark streaks at the image periphery (black arrows) generated by iMAR (B).