
Figures & data
Figure 1. Laparoscope and transvaginal ultrasound images of the uterus. Laparoscope image before (A) and after (B) needle antenna puncturing into the uterus. Transvaginal ultrasound image before (C) and after (D) needle antenna (arrow) puncturing into the uterus.
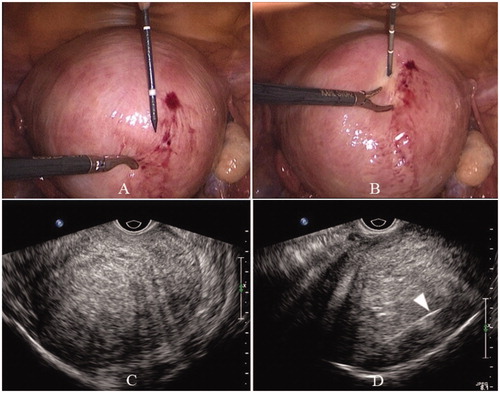
Figure 2. Laparoscope and transvaginal ultrasound images during ablation. Hyperechogenic signal under transvaginal ultrasound guidance indicates ablation area (A–E), and the scope of the hyperechogenic signal becomes larger and larger. Uterus shrinkage and color change from bright red to pale on laparoscope (F). (Red arrows indicate the area of the hyperechogenic signal.)
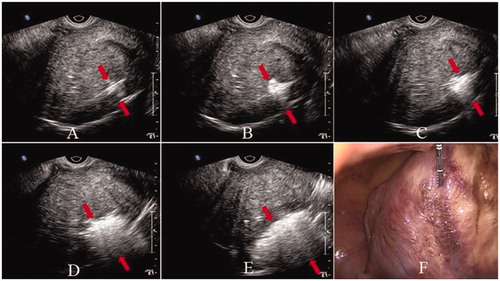
Figure 3. Contrast-enhanced ultrasonography (CEUS) was immediately performed to assess the effectiveness of WMA, and necrotic areas are shown as nonenhanced areas on CEUS. BL: bladder; UT: uterus. Red arrows indicate the area of the lesion.
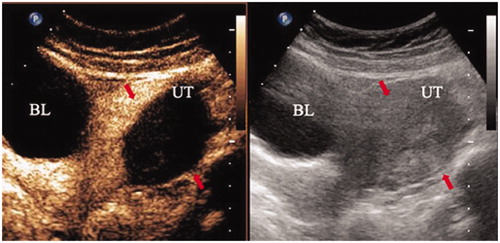
Table 1. Baseline information.
Figure 4. Change in lesion volume before PMWA and at follow-up on MRI. A: Lesion size before PMWA (A), 1 month (B), 6 months (C) and 12 months (D) after PMWA.
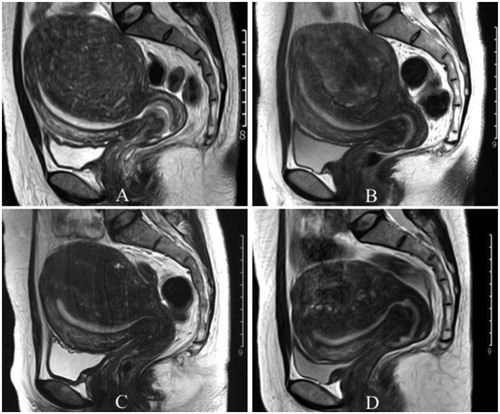
Table 2. Uterine volume, lesion volume, SSS and VAS score before and after microwave ablation of group 1.