Figures & data
Figure 1. Simplified model of necrosis as sphere of diameter d with constant specific absorption rate (SAR) inside and perfusion w = 0. The sphere is embedded in an infinite medium with 0 SAR and arbitrary w.
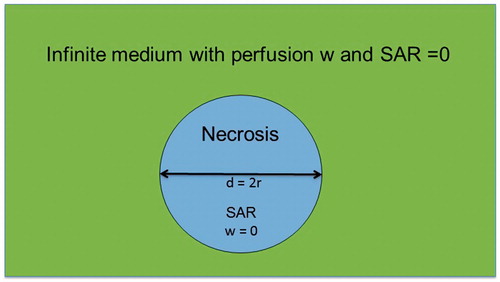
Figure 2. Simplified tumor model with cubical tumor cells or cell clusters of extension di (‘i’ for intracellular) in extracellular medium ‘e’ of width de. Assuming a tumor cube of edge length L [cm], we can determine the number N3 of tumor cell clusters from di and de. The tumor is more solid and more hydrated for di > de and di < de, respectively. The cell membrane has ∼5-nm thickness. The cell cluster arrangement is continued in all directions. The figure illustrates a di = 2 × de relationship yielding 70% extracellular fluid (ECF, see text). This is a three-dimensional model with the coordinate origin and x/y axes plotted for analytical solution (EquationEquations 7–9).
![Figure 2. Simplified tumor model with cubical tumor cells or cell clusters of extension di (‘i’ for intracellular) in extracellular medium ‘e’ of width de. Assuming a tumor cube of edge length L [cm], we can determine the number N3 of tumor cell clusters from di and de. The tumor is more solid and more hydrated for di > de and di < de, respectively. The cell membrane has ∼5-nm thickness. The cell cluster arrangement is continued in all directions. The figure illustrates a di = 2 × de relationship yielding 70% extracellular fluid (ECF, see text). This is a three-dimensional model with the coordinate origin and x/y axes plotted for analytical solution (EquationEquations 7–9).](/cms/asset/d65334dc-5619-4060-a5ad-ab3109f67e84/ihyt_a_1692376_f0002_c.jpg)
Figure 3. Simplified model of normal tissue such as muscle or liver. The extracellular space has a share of 20%, yielding this scale drawing (see text). Therefore, the functional units are considerably larger than the tumor cell cluster of and de ≪ di. Because of the narrow interstitium of only a few micrometer, the membrane accessibility as regards electrical processes may be reduced. The membrane area is further decreased by the interconnections between the normal tissue cells (e.g., tight junctions), as sketched between the functional units.
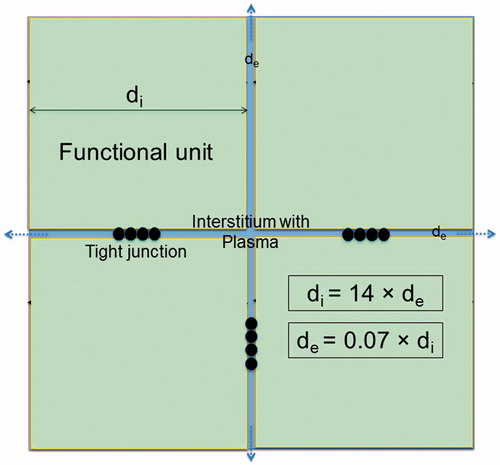
Table 1. Compilation of physical constants and formulas used in main text [Citation6,Citation21–22]. For our purposes, the frequency range can be restricted to <100 MHz. The relaxation times depending on the spot size are given below (see Discussion).
Figure 4. Equivalent circuit diagram of tumor, acting as demodulator of AM RF frequency at 13.56 MHz. The membranes (top left) are comparable to a rectifier diode (top right), because they have high permeability/conductivity for K+ and Cl− ions (forward direction) and are much less permeable for Na+ and A− (backward direction). The resistance R and capacitance C of the membranes or cell formations of the tumor determine the demodulation condition (see text). The electrical parameters can be derived utilizing the parameters of . The power absorption of the tumor may be increased by adjusting the carrier frequency v or the modulation frequency spectrum to the specific tumor (bottom left) and its electrical attributes (bottom right).
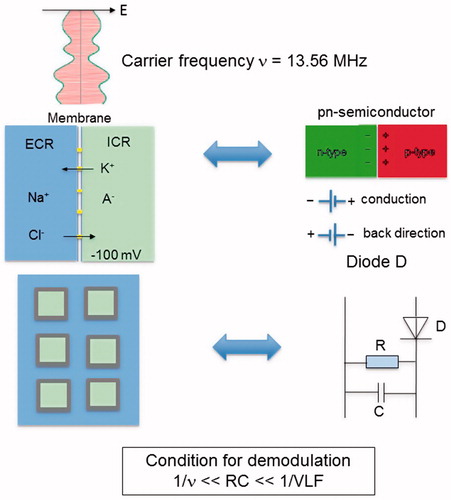
Figure 5. Temperature distributions for SAR peaks in spheres of 5-mm (bottom) or 10-mm (top) diameter, illustrating the possibility of ‘point heating’. For lesions of ≤1 cm, extremely large SAR of hundreds of Watts per kilogram are required to obtain a relevant temperature >41 °C (still far from cytotoxic temperatures). On the other hand, temperature elevations of centimeter range around the lesion are measurable. Therefore, ‘point heating’ in the absence of bulk heating is physically impossible. The formula for the maximum temperature increase θmax in the lesion center () or the ECF () is given together with the temperature increase θ0 at the edge. The temperature at the ordinate is given by 37.5 °C+θ (using EquationEquations 5a(5a)
(5a) and Equation5b
(5b)
(5b) ).
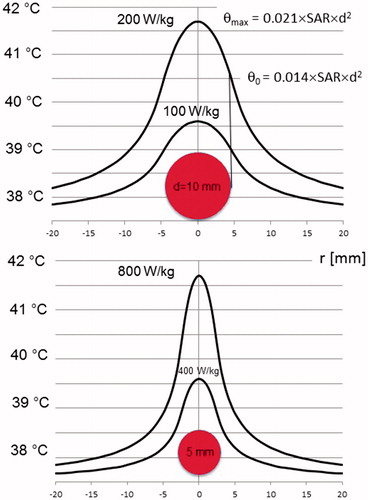
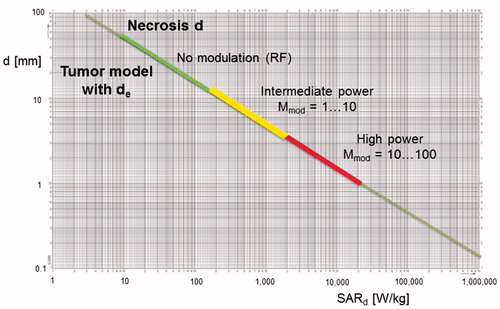
Figure 6. Diameters d of spherical hot spots (θmax = 6 °C) versus required SAR peaks in sphere. Three colored ranges of hot spot development according to the degree of power enhancement K by VLF modulation are shown. For RF alone (K = 0), up to SAR = 100 W/kg, only necrotic/aqueous areas of centimeter size can be heated. For high power dissipation via VLF modulation (K = 100) above SAR = 10,000 W/kg, necrotic/aqueous areas down to millimeter d are effectively heated; however, necrotic/aqueous areas of microscopic dimensions (e.g., d of 100 µm) are still excluded. For areas of d ∼ 100 µm, excessive (unrealistic) values of SAR > 1,000,000 W/kg are required. This general diagram is also valid for microscopic d from micrometer down to nanometer scales (nanoheating range), requiring SAR values of up to a quadrillion (EquationEquation 10b(10b)
(10b) ).