3,424
Views
14
CrossRef citations to date
0
Altmetric
Research Article

PIPAC versus HIPEC: cisplatin spatial distribution and diffusion in a swine model

, , , , , , , ORCID Icon, , , , , & show all
Pages 144-150 | Received 27 Mar 2019, Accepted 30 Nov 2019, Published online: 31 Jan 2020

Figures & data

Figure 1. Boxplot showing topographic distribution of cisplatin tissular concentrations in the HIPEC and PIPAC groups. For each station, comparison has been performed between HIPEC and PIPAC groups using non-parametric tests (exact Mann–Whitney test). IQR: interquartile range.

Figure 1. Boxplot showing topographic distribution of cisplatin tissular concentrations in the HIPEC and PIPAC groups. For each station, comparison has been performed between HIPEC and PIPAC groups using non-parametric tests (exact Mann–Whitney test). IQR: interquartile range.

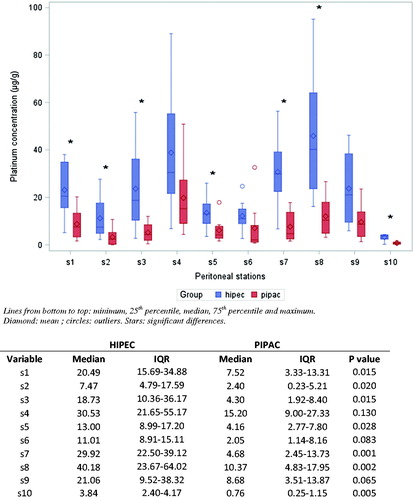
Table 1. Tissular platinum concentrations.

Figure 2. Comparison of plasmatic cisplatin concentration between HIPEC and PIPAC.

Figure 2. Comparison of plasmatic cisplatin concentration between HIPEC and PIPAC.

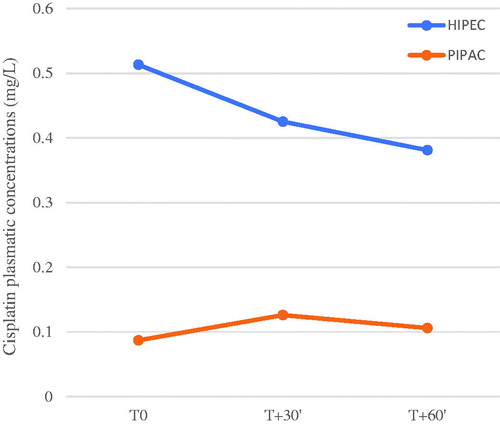
Table 2. Cisplatin plasmatic concentrations according to time of sampling.