
Figures & data
Figure 1. Flow diagram shows exclusion criteria in patients with ovarian cancer liver metastasis (OCLM).
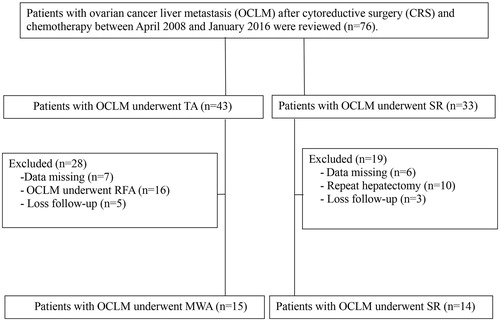
Figure 2. A 55-year-old woman with solitary ovarian cancer liver metastasis (OCLM). (A) Contrast-enhanced CT shows ovarian cancer (OC) lesions (arrow) located on left ovary in the arterial phase; (B) Contrast-enhanced CT shows OCLM lesion (*, arrow) located on S6 in liver; (C) Contrast-enhanced CT shows OC lesions removed by cytoreductive surgery (CRS) after 1 month (arrow); (D) Contrast-enhanced CT shows OCLM lesion (*, arrow) underwent surgical resection after 4 months.
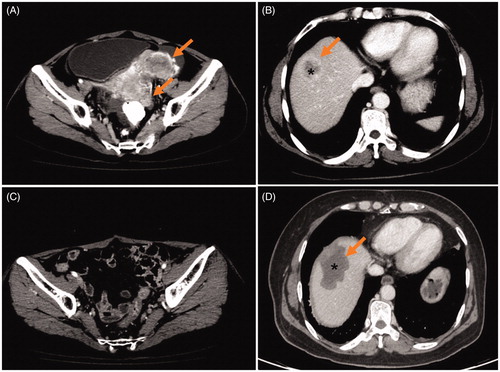
Figure 3. A 48-year-old woman with solitary ovarian cancer liver metastasis (OCLM). (A) Contrast-enhanced CT shows ovarian cancer (OC) lesions (arrow) located on ovary in the arterial phase; (B) Contrast-enhanced CT shows OCLM lesion (*, arrow) located on S7 in liver; (C) Contrast-enhanced CT shows OC lesions removed by cytoreductive surgery (CRS) after 3 months (arrow); (D) Contrast-enhanced CT shows OCLM lesion (*, arrow) underwent microwave ablation (MWA) after 2 months.
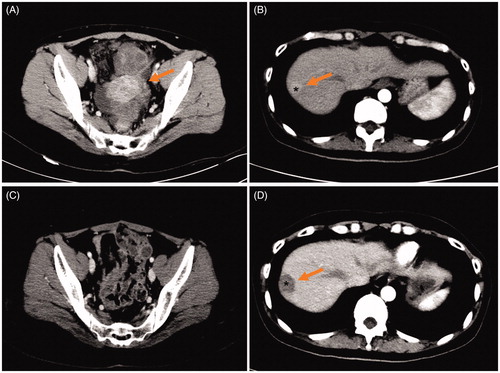
Table 1. Characteristics of patients with OCLM.
Table 2. Comparation of treatment parameters and postoperative outcomes between MWA and SR group.
Table 3. Serum CA-125 levels for all the patients at multiple time points.
Table 4. Preoperative and postoperative liver function between MWA group and SR group.
Figure 4. Graphs show cumulative OS and LRFS rates in patients with OCLM. (A) comparation of cumulative 1-, 3-, 5-years OS between SR group and MWA group; (B) comparation of cumulative 1-, 3-, 5-years LRFS between SR group and MWA group.
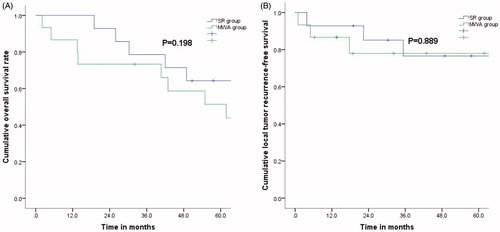
Table 5. Multivariate analysis of prognostic factors with OS.
Table 6. Multivariate analysis of prognostic factors with LTP.