
Figures & data
Figure 1. Consort 2010 flow diagram.
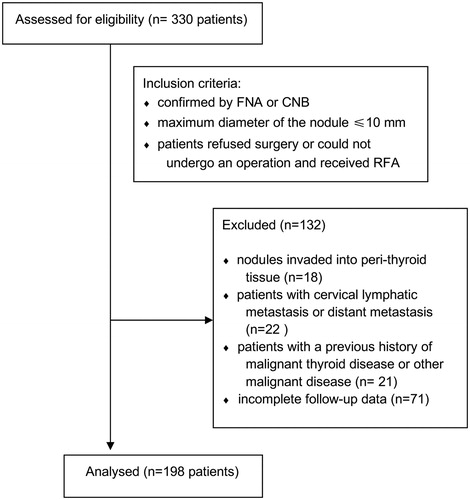
Table 1. Characteristics of nodules proved to be PTMC under US or CEUS.
Figure 2. The preoperative and postoperative pathological images of the patient. (A) PTC was diagnosed by preoperative biopsy pathology; (B) degenerative changes were revealed in postoperative biopsy pathology.
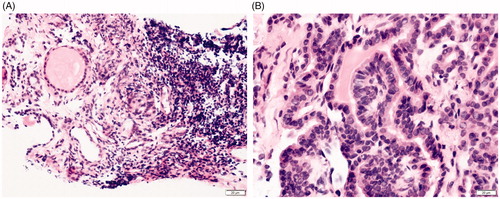
Figure 3. Preoperative imaging and CEUS imaging immediately after RFA. (A) Preoperative CEUS imaging showing the hypoechoic nodule was low-enhanced; (B) CEUS imaging immediately after RFA revealed a non-enhanced area of 1.6 cm × 1.4 cm ×1.2 cm in the ablated area.
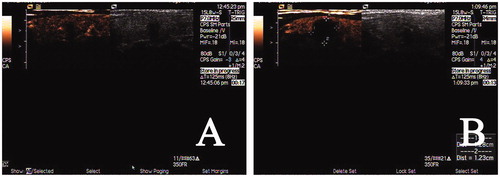
Figure 4. Post-operative CEUS images during follow-up. (A) the non-enhanced area was 1.4cmx1.3cmx1.1cm 1 month after RFA; (B) the non-enhanced area was 0.9cmx0.9cmx0.8cm 3 months after RFA; (C) the non-enhanced area was 0.2cmx0.3cmx0.3cm 18 months after RFA (VRR was 99%).
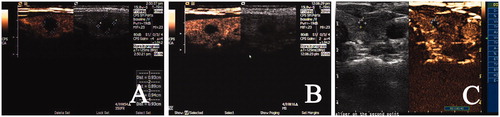
Table 2. Changes of volume and VRR after RFA in the follow-ups.