
Figures & data
Figure 1. The geometry of computational model (not to scale).
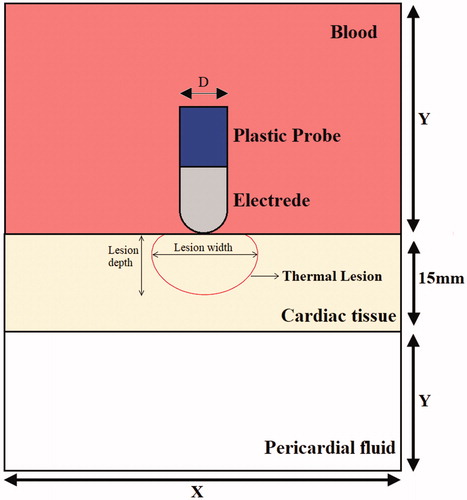
Table 1. Thermal and electrical characteristics of the elements of the numerical models.
Figure 2. Mechanical, electrical and thermal boundary conditions.
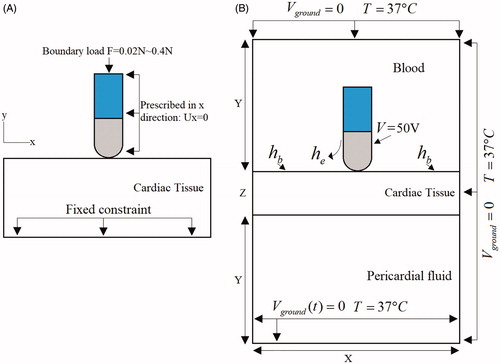
Figure 3. The deformation of cardiac tissue and the displacement field distributions. (A) F = 2 g, (B) F = 5 g, (C) F = 10 g, (D) F = 20 g, (E) F = 30 g, (F) F = 40 g.
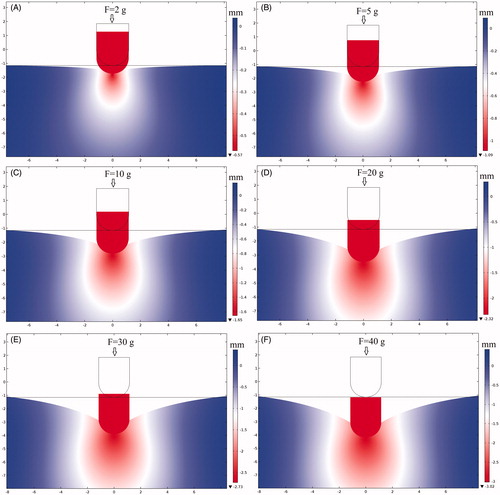
Figure 4. Maximum displacement in y direction vs. contact force.
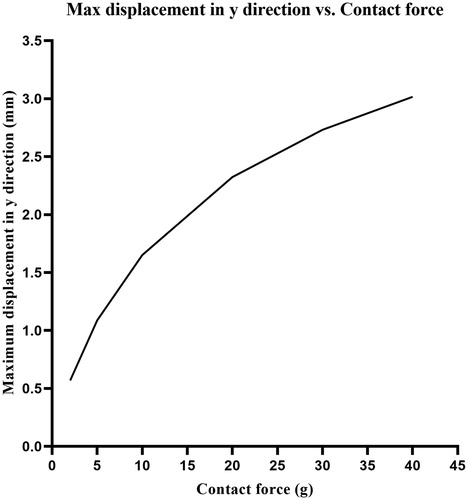
Figure 5. The distribution of electric field intensity, current density, and power density.
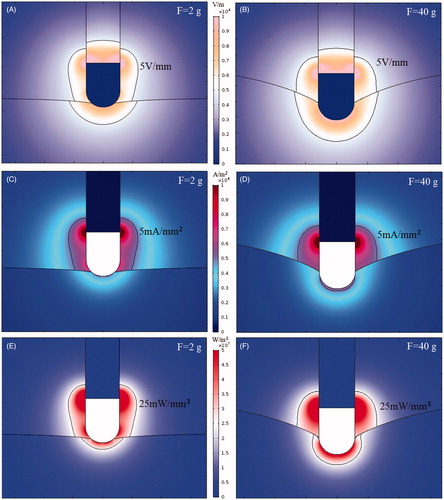
Figure 6. Temperature distribution at different CF. (A) F = 2 g, V = 50 V, t = 30 s, (B) F = 5 g, V = 50 V, t = 30 s, (C) F = 10 g, V = 50 V, t = 30 s, (D) F = 20 g, V = 50 V, t = 30 s, (E) F = 30 g, V = 50 V, t = 30 s, (F) F = 40 g, V = 50 V, t = 30 s.
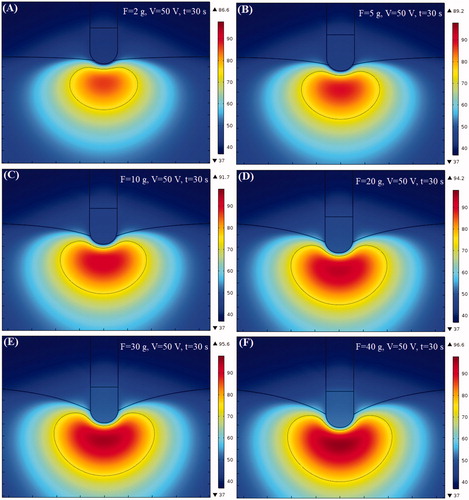
Figure 7. (A) Max temperature of myocardium, (B) lesion area vs ablation time, (C) Myocardial impedance vs ablation time, (D) power vs ablation time.
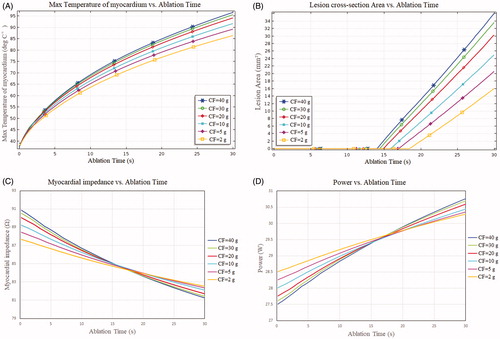
Figure 8. (A) Lesion depth vs ablation time, (B) lesion width vs ablation time, (C) max lesion depth vs contact force, (D) max lesion width vs contact force.
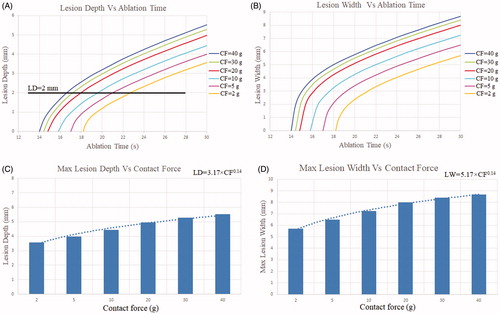
Table 2. Maximum myocardial temperature, impedance change, lesion cross-section area, lesion depth, and lesion width at different CF values.