
Figures & data
Figure 1. Results of diagnostic imaging throughout the disease course. (A) Whole body metabolic F-18 fluorodeoxyglucose (FDG) PET (maximum intensity projection, left) and axial CT, PET-CT, and PET (right, from top to bottom) of a cervical and an abdominal cross-section imaging are shown, corresponding to the timeline showing therapy and disease status. Red circles of the whole body PET indicate the bone metastasis of the right humerus and red circles of the PET on the cervical cross-section show the metabolic activity of the left lymphadenopathy which is also marked by white and green arrows of the CT and PET-CT. The abdominal cross-section shows the abdominal tumor mass with high metabolic activity. Panel A (left) represents the status two months before start of treatment with regional hyperthermia and low-dose chemotherapy. Of note is the high metabolic activity of multiple bone lesions (e.g., scapula, vertebral column, right humerus, pelvis, sternum, and os sacrum). Panel B shows images 1 month after DLI, when the response to DLI had not occurred, with apparent continued worsening disease at all three sites, showing progression of the abdominal tumor, the appearance of a new bone lesion at the right extremity, and the increased size of the lymphadenopathy with increased metabolic activity before entering treatment. Panel C shows images 12 weeks after two treatment cycles. The heat-targeted abdominal tumor mass showed a partial response with lower metabolic activity. Furthermore, disease response outside of the hyperthermia field was seen with only minor remaining activity detectable at the right humerus (red circle) and at the involved left lymph node (CT, white arrow and PET-CT, green arrow). Panel D shows images after nine treatment cycles with complete response of the abdominal tumor and of distant metastases. Rest of focal activity corresponds to an implanted stent. Panel E illustrates 2 months after end of the 11th cycle the recurrence of local and distant disease at multiple sites. Enlargements are shown for Panel B (12/2010) at recurrent progressive disease and D (08/2011) at complete remission after regional hyperthermia plus low-dose chemotherapy. (B) Schematic drawing of the treatment course: The numbers (blue) indicate the number of each cycle of low-dose chemotherapy combined with regional hyperthermia. The date of imaging and disease status is given by the letters A, B, C, D, and E.
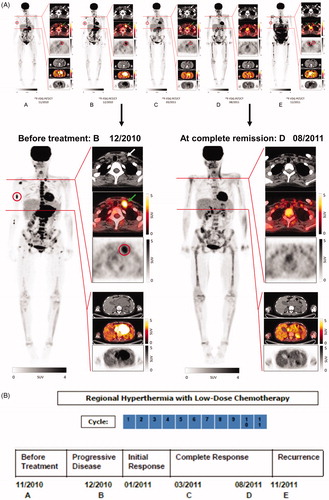
Figure 2. (A) White blood cell (WBC) counts (number × 109/l) and (B) monocytes given as percentage (%) of WBC counts, of peripheral blood samples taken before start of regional hyperthermia with low-dose chemotherapy, from 1st to 11th treatment cycles, and during the time of relapse.
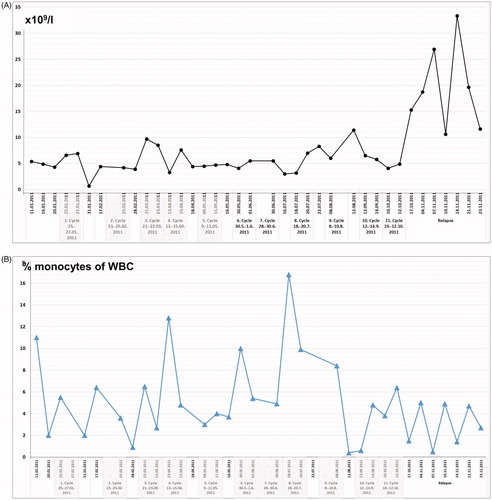
Figure 3. Changes of NKG2D expression on NK and T cells, CD3-CD56bright NK cells, lytic NK cell activity, and frequency of T cell subsets during regional hyperthermia and low-dose chemotherapy. PBMCs were collected at different time points during the disease course and used to measure lytic activity and to define cell subset composition by flow cytometry. Respective measurements were also performed with blood samples of the father (control). (A) Increase in frequencies of NKG2D-expressing cells in patient lymphocytes between the second and fifth treatment cycle. Depicted are CD56/NKG2D and CD3/NKG2D dot plots of lymphocytes (gated as alive, single, small cells in PBMCs). Numbers in the respective quadrants refer to the percentage positively stained cells. In the CD56/NKG2D dot plot, the upper right quadrants are CD56+NKG2D+ cells, which correspond to NKG2D+ NK cells (3.5% and 19.5%, respectively). Lower right quadrants are CD56+ NKG2D− cells. The lower left quadrants are NKG2D−CD56− lymphocytes (B cells and NKG2D− T cells). In the CD3/NKG2D dot plot, the upper right quadrant corresponds to the CD3+NKG2D+ T cells, which are 11% (second treatment cycle) and 13% (fifth treatment cycle). The quadrants were set according to isotype control stainings. The dynamics of NKG2D expression on NK cells (CD56+NKG2D+) and T cells (CD3+NKG2D+) is shown in the bottom graph. The values at each treatment cycle are the percentages of CD3+NKG2D+ and CD56+NKG2D+ cells among gated live lymphocytes. (B) Increase in frequency of CD3-CD56bright NK cells in the patient’s PBMCs before (closed squares) and after (closed circles) the 2nd, 4th, 5th, 7th, 8th, 9th, 10th, and 11th treatment cycles and at relapse (4th November 2011) in comparison to PBMCs of the father at different time points (open diamonds). The values are the percentages of all CD56bright NK cells within the NK cell population (without discrimination according to CD16 expression), gated as CD3−CD56+ lymphocytes. The increase of CD3−CD56bright NK cells over the disease course was statistically significant (p = 0.031) considering the values measured before each treatment cycle. For details concerning the flow cytometry and statistics see Supplementary Appendix. (C) Upper panel: lytic activity of ex vivo IL-2-stimulated (red) and unstimulated (blue) PBMCs of the patient (before the fourth treatment cycle) against K562 cells at effector (PBMC) to target (K562) ratios of 10:1 to 0.3:1, as determined by a standard 4-h Europium assay. Lower panel: Lytic activity of ex vivo IL-2-stimulated PBMCs of the patient (before the fourth treatment cycle, red) and the father (control, blue) against K562 cells at effector (PBMC) to target (K562) ratios of 10:1 to 0.3:1, as determined by a standard 4-h Europium assay. Mean values of triplicates are shown in the experiment. The specific lysis is calculated according to the equation: (experimental release – spontaneous release)/(maximum release – spontaneous release) x 100. For technical details see Supplementary Appendix. (D) CD4+ and CD8+ T cell frequencies in PBMCs taken before (closed squares) and after (closed circles) the 4th, 5th, 7th, 8th, 9th, 10th, and 11th treatment cycles and at relapse (4th November 2011) in comparison to PBMCs of the father (control) at different time points (open diamonds). The frequencies were determined by flow cytometry after gating on live, single CD3+ T cells. For technical details see Supplementary Appendix. (E) Change in frequencies of CD4+ T effector/memory (Teff/em) and terminally differentiated CD8+ T cells (Temra) and (F) Change in frequency of naive CD4+ and CD8+ T cells (CD45RA+CCR7+) in patient PBMCs before (squares) and after (circles) the 5th, 7th, 8th, 9th, 10th and 11th treatment cycles, and at relapse (4th November 2011) compared to father (control). PCMCs were stained with antibodies to CD3, CD4, CD8 CD45RA and CCR7. The CD3+ T cells were selected and subdivided for CD4+ and CD8+ T cells, which were then subcategorized according to the markers CD45RA and CCR7 in naïve (CD45RA+CCR7+), effector/memory (Teff/em, CD45RA−CCR7−), central memory (Tcm, CD45RA−CCR7+) and terminally differentiated cytotoxic T cells (Temra, CD45RA+CCR7−) (for details see Supplementary Appendix). Temra are mostly found in the CD8+ T cell population and represent those with a cytotoxic differentiation status. (G) Decline in frequencies of CD25+FOXP3+ regulatory T cells (Treg cells) during treatment course, including the time point at relapse. PBMCs were stained with antibodies to detect CD3, CD4, CD25 and FOXP3, the later following cell permeabilization. The frequency of CD25+FOXP3+ Treg cells was determined among the CD4+ T cells by gating on live CD3+CD4+ lymphocytes. Depicted are the percentages of CD25+FOXP3+ Treg of the patient PBMCs harvested before the indicated treatment cycle (black squares) and the father’s PBMCs at different time points. The decline overs disease course was statistically significant (p = 0.031). For technical details regarding flow cytometry and statistics see Supplementary Appendix.
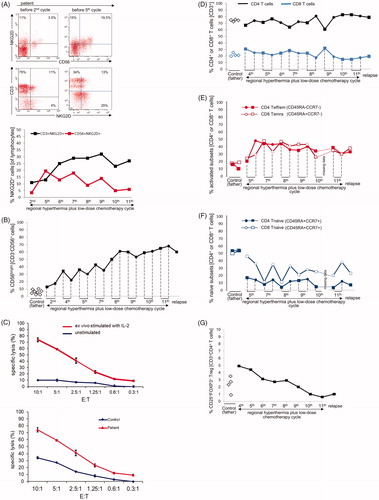
Figure 4. Immunohistochemical analysis of lymphocytic infiltrates in the skin biopsies. H&E sections of the skin biopsy taken in February 2011 (A, 200-fold) and November 2011 (B, 200-fold) are shown. After regional hyperthermia concurrent with the skin erythema, a chronic interface dermatitis with focal epithelial lymphocytic infiltrates was found in both biopsies. The magnified image (C, 630-fold) revealed epidermal spongiosis, vacuolization of basal cell layers, and dyskeratotic keratinocytes with few apoptotic bodies. The immunohistochemistry showed an infiltration by CD3+ T-lymphocytes (D) which consisted predominately of CD8+ cytotoxic T lymphocytes (E) and fewer CD4+ T helper cells (F).
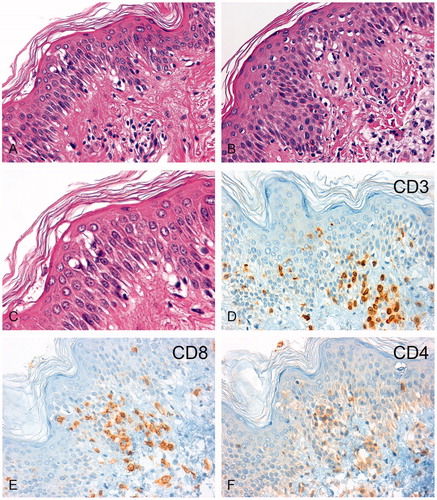
Figure 5. (A) Working hypothesis of (heat) stress-induced immune activation. CD56bright NK cells expressing the NKG2D activating receptor ![]()
![Figure 5. (A) Working hypothesis of (heat) stress-induced immune activation. CD56bright NK cells expressing the NKG2D activating receptor Display full size interact with MICA/B Display full size and HSP70 Display full size that are co-induced on tumor cells by regional hyperthermia. Activated CD56bright NK cells have the capacity to lyse tumor cells directly [Citation18,Citation20,Citation37–39]. CD56bright NK cells secret IFN-γ and thereby promote the activation of CD4+ helper T cells. CD4+ helper T cells recognize tumor peptides Display full size presented by MHC class II molecules on DCs and thereby can stimulate the CTL response of CD4+ effector/memory T cells (modified from Ref. [Citation7]). Alternatively, HSP70-chaperoned tumor peptides (HSP70-peptide complexesDisplay full size) released from the dying tumor (immunogenic cell death through hyperthermia) are taken up by DCs. Cross-presentation of peptides by MHC class I molecules on DCs then stimulate the response of CD8+ cytotoxic T cells [Citation37,Citation38]. Low-dose chemotherapy is able to kill Treg cells, thereby, blocking the immunosuppressive effects of Treg cells on the CTL response [Citation16]. (B) Despite the setting of HLA haplotype-mismatched HSCT, where NK cells are not inhibited by KIR/HLA class I interactions, tumor cell killing does not occur if the tumor cells lack activating ligands (MICA, HSP70) for the NK cell-expressed activating receptor NKG2D and if Tregs are present (modified from Refs. [Citation7,Citation22]). The capacity of allogeneic cytotoxicity of NK cells can be restored by hyperthermia which is known to induce MICA/B and HSP70 expression on the tumor cells. This provides the signals for the NKG2D activating receptor expressed on NK cells [Citation18]. Low-dose chemotherapy is able to kill Treg cells, thereby blocking the immunosuppressive effects of Treg cells on the allogeneic NK activity [Citation16]. Abbreviations: CTL: cytotoxic T cell; DC: dendritic cell; HLA: human leukocyte antigen; HSP: heat shock protein; HSCT: hematopoietic stem cell transplantation; IFN-γ: interferon gamma; KIR: killer immunoglobulin-like receptor; MIC or MIC: MHC class I chain-related protein family; MHC: major histocompatibility complex; NK: natural killer; NKG2D: natural killer group 2D; Treg: regulatory T cells.](/cms/asset/5682cb13-5c95-4a97-b2fd-2cde546d0bda/ihyt_a_1709666_f0005_c.jpg)
Supplemental Material
Download PDF (560.6 KB)Data availability
All data generated or analyzed during the current study are available from the corresponding author on reasonable request.