Figures & data
Table 1. Values of the electrical tissue properties at 8, 70, and 100 MHz used in the simulations [Citation43–45]; electrical conductivity (σ [S m−1]); and relative permittivity (εr [−]).
Table 2. Values of the thermal tissue properties used in the simulations [Citation14,Citation43,Citation45]; density (ρ [kg m−3]), specific heat capacity (c [J kg−1 °C−1]), thermal conductivity (k [W m−1 °C−1]), and perfusion (Wb [ml 100 g−1 min−1]).
Figure 1. Predicted (1 cc average) SAR distributions for the five different hyperthermia systems heating a homogeneous muscle-equivalent quality assurance phantom with a PVC shell. A cylindrical target region (10 × 25 × 40 cm) was defined to mimic peritoneal heating, as indicated by the pink contour. Slices were taken through the center of the target.
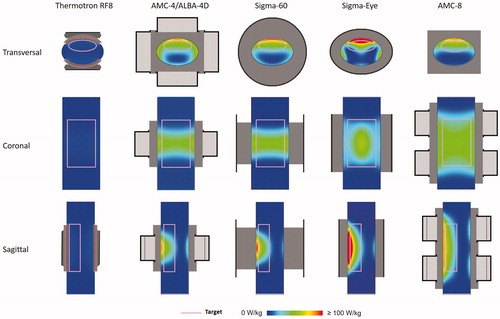
Figure 2. Predicted (1 cc average) SAR volume histogram of the cylindrical peritoneum-mimicking target region (10 × 25 × 40 cm), simulated in a standard homogeneous muscle-equivalent quality assurance phantom with a PVC shell, for different locoregional heating devices.
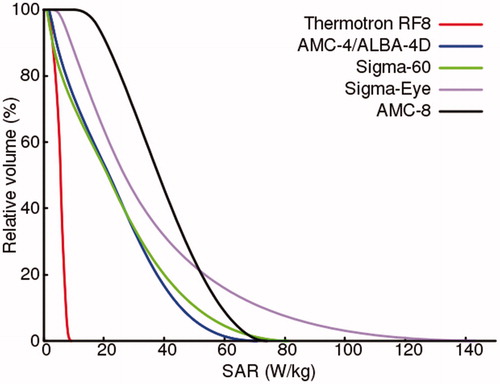
Table 3. Values of the simulated target (1 cc average) SAR50 values, the maximum SAR values in the target, as well as the overall maximum SAR values for heating a homogeneous phantom with a PVC shell using different locoregional heating devices.
Figure 3. Predicted (1 cc average) SAR distributions for the five different hyperthermia systems heating the peritoneum for patient 1 (female).
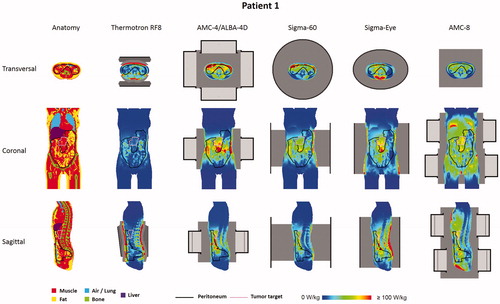
Figure 4. Predicted (1 cc average) SAR distributions for the five different hyperthermia systems heating the peritoneum for patient 2 (male).
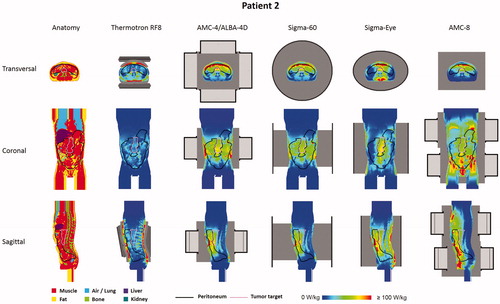
Figure 5. Predicted (1 cc average) SAR–volume histogram of the peritoneum and tumor target (insert) for both patients, for locoregional heating with different hyperthermia devices.
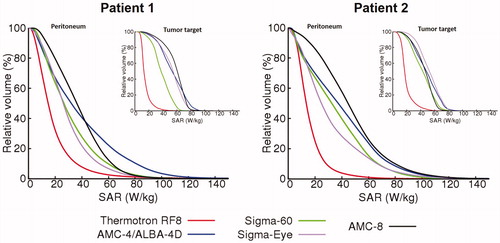
Table 4. Values of the simulated (1 cc average) SAR50 and maximum SAR values in the peritoneum and the tumor target, as well as the overall maximum SAR for heating two pancreatic cancer patients with five different locoregional devices.
Figure 6. Predicted temperature–volume histogram of the peritoneum and tumor target (insert) for both patients, for locoregional heating with different hyperthermia devices.
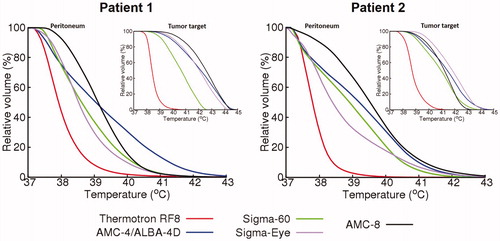
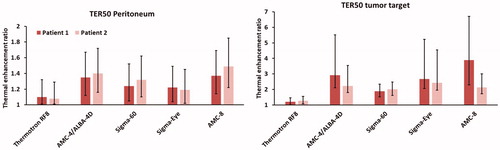
Table 5. Predicted TER for oxaliplatin achieved in at least 50% of the peritoneum or tumor target (TER50) for both patients, for locoregional heating with different hyperthermia devices.
Figure 7. Predicted TER and the variation in TER for oxaliplatin achieved in at least 50% of the peritoneum or tumor target (TER50) for both patients, for locoregional heating with different hyperthermia devices, when assuming an uncertainty in the temperature distribution of ± 1 °C. The Colored bars represent the values listed in and the error bars represent the TER50 values for temperature distributions 1 °C lower or higher than the predicted temperature distributions.