
Figures & data
Figure 1. Flow diagram shows study patient accrual process. US-PMWA: ultrasound-guided percutaneous microwave ablation; HCC: hepatocellular carcinoma.
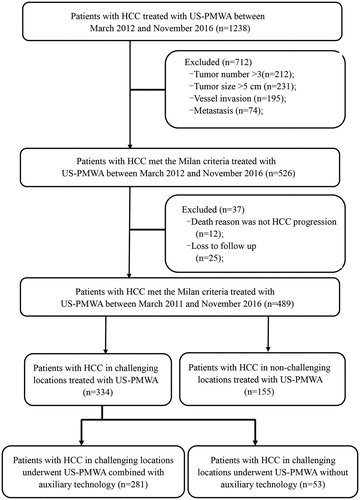
Figure 2. The HCC lesions in six types of CLs underwent US-PMWA. (A) MRI scan showed a nodule (red arrow) abutting to the stomach (yellow arrow) before MWA on the T2-weighted image and an ablation zone (red arrow) after MWA on the delay phase image. (B) MRI scan showed a nodule (red arrow) abutting to the gallbladder (yellow arrow) before MWA on the T2-weighted image and an ablation zone (red arrow) after MWA on the delay phase image. (C) MRI scan showed a nodule (red arrow) abutting to the first hepatic hilar (yellow arrow) before MWA on the T2-weighted image and an ablation zone (red arrow) after MWA on the delay phase image. (D) MRI scan showed a nodule (red arrow) abutting to the hepatic vein (yellow arrow) before MWA on the hepatic arterial phase image and an ablation zone (red arrow) after MWA on the delay phase image. (E) MRI scan showed a nodule (red arrow) abutting to the diaphragm (yellow arrow) before MWA on the T2-weighted image and an ablation zone (red arrow) after MWA on the delay phase image. (F) MRI scan showed a nodule (red arrow) abutting to the capsule (yellow arrow) before MWA on the T2-weighted image and an ablation zone (red arrow) after MWA on the delay phase image.
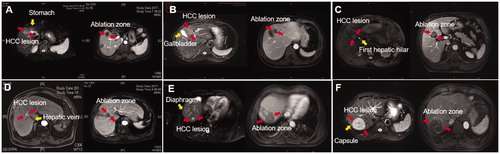
Figure 3. The four types of AATs were applied to assistance of US-PMWA for HCC lesions in CL. (A) A 65-years old, female patient had a HCC nodule (4.4 cm × 4.1 cm × 2.9 cm in diameter) located in S6 who underwent 3 D visualization preoperative planning; (B) A patient with HCC nodule (1.4 cm × 1.1 cm × 0.9 cm in diameter) located in S7 who under multimodal image fusion guided MWA; (C) A thermal monitoring needle was inserted the location abutting to the gallbladder (red arrow) for real-time temperature monitoring for the duration of ablation under US guidance; (D) The artificial ascites (yellow arrow) generated to separate the tumor from the hepatic capsule under US guidance during ablation procedure (red arrow).
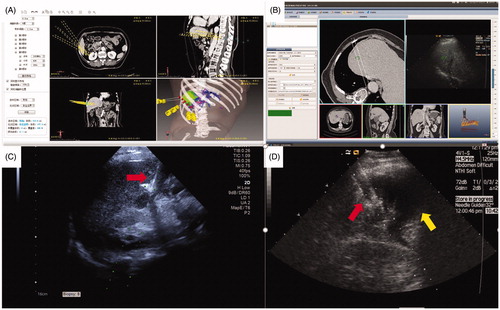
Table 1. Baseline patient characteristics.
Table 2. Comparation of ablation parameters between CL and Non-CL group.
Figure 4. Comparation of the 1-, 2-, and 3-year OS between CL and non-CL group used to plot Kaplan-Meier curves. (A) lesion abutting adjacent vital; (B) lesion abutting gallbladder; (C) lesion abutting hepatic hilar regions; (D) lesions abutting major vessel; (E) lesions abutting diaphragm; (F) lesions abutting capsule.
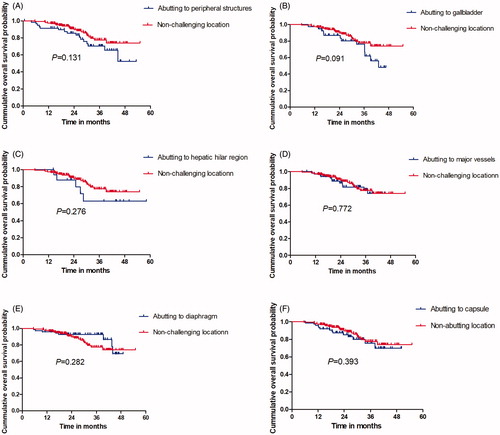
Figure 5. Comparation of the 1-, 2- and 3-year RFS between CL and non-CL group used to plot Kaplan–Meier curves. (A) lesion abutting adjacent vital; (B) lesion abutting gallbladder; (C) lesion abutting hepatic hilar regions; (D) lesions abutting major vessel; (E) lesions abutting diaphragm; (F) lesions abutting capsule.
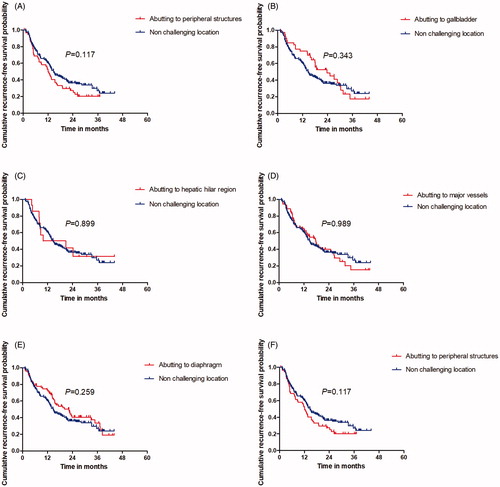
Table 3. Comparation of survival outcomes between CL and non-CL group.
Figure 6. The oncological outcomes of patients with HCC in CL who underwent US-PMWA assisted by AATs. (A) The 1-, 2- and 3-year OS rates were compared between ATT and non-ATT group; (B) The 3-, 6-, 9- and 12-months LTP rates were compared between ATT and non-ATT group; (C) The 1-, 2- and 3-year IDR rates were compared between ATT and non-ATT group; (D) The 1-, 2- and 3-year EDR rates were compared between ATT and non-ATT group.
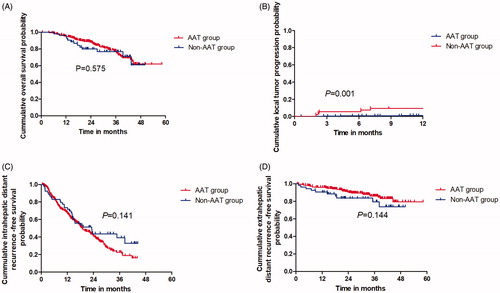
Table 4. Factors associated with poor OS after MWA for HCC in CLs according to univariate and multivariate analysis.
Table 5. Factors associated with poor LTP after MWA for HCC in CLs according to univariate and multivariate analysis.
Table 6. Comparison of major complications between the CL group and non-CL group.