Figures & data
Figure 1. Human ovarian cancer cells (SK-OV-3) were transfected with HSV-TK/GFP lentiviral particles. Fluorescent microscopy and quantitative assay by flow cytometry show the increasing expression of GFP in the cells over the period of 7 days, reaching the peak 5 days after gene transduction and maintaining a relatively high level over the following days.
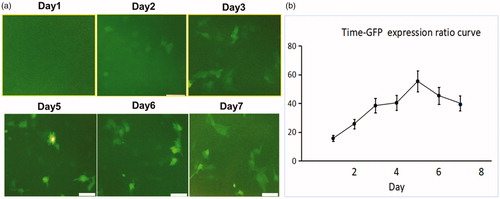
Figure 2. In vitro experiments tested the therapeutic effect of different treatments on ovarian cancer cells transfected with lentiviral mCherry/Luciferase gene. (a) Confocal microscopy showed a significantly smaller number of cells surviving the HSV-TK/GCV gene therapy combined with RFH compared to other three groups. (b) MTS assay showed the lowest cell viability in the combination therapy group (*p < .05). (c) BLI of cells further confirmed the synergistic effect of the combination therapy, shown as a significantly decreased photon signal of cells in the combination therapy group (*p < .05). (d, e) Western blotting quantification of GFP expression level in cells treated with and without RFH enhancement demonstrated an increased gene transduction with RFH (p < .05, n = 6 per group).
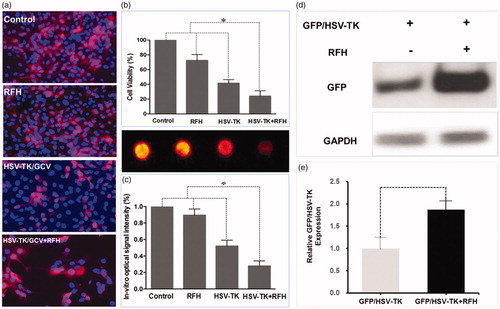
Figure 3. Ovarian cancer cells were injected into the rat ovary to create an orthotopic cancer model. (a) The left ovary was exposed by aseptic surgery. (b) 0.5–1 × 10⁷ ovarian cancer cells were injected into the ovary through a 27 G needle. (c, d) BLI detected the bioluminescence signal of the tumor 2 weeks after the cancer cell inoculation. (e, f) Gross specimen showed the orthotopic tumors in the ovary, which was further confirmed by histologic analysis (g). (h) Regression analysis revealed a significant correlation between bioluminescence and tumor size (R2=0.9115, p < .05).
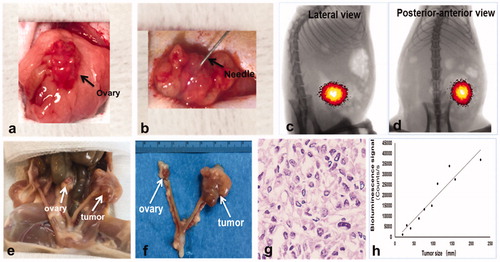
Figure 4. Ultrasound imaging-guided intratumoral gene therapy of rat orthotopic ovarian cancer. (a) A multipolar RF/perfusion electrode was used to deliver RFH and HSV-TK/lentiviral particles simultaneously into the tumor. (b) Under ultrasound imaging guidance, the RF/perfusion electrode was precisely positioned into the ovarian tumor.
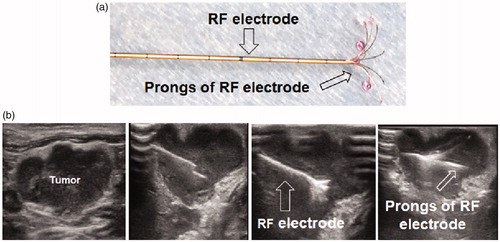
Figure 5. Four groups of nude rats with orthotopic ovarian cancer were treated with intratumoral PBS, RFH, HSV-TK/GCV gene therapy, and combination of both. Optical/X-ray images showed the bioluminescence signal of tumors. Compared to the other three groups treated with PBS, RFH, HSV-TK/GCV gene therapy alone, the combination therapy significantly retarded tumor growth, manifesting as a significant decrease in bioluminescence signals (red-yellow colors) (***p < .001).
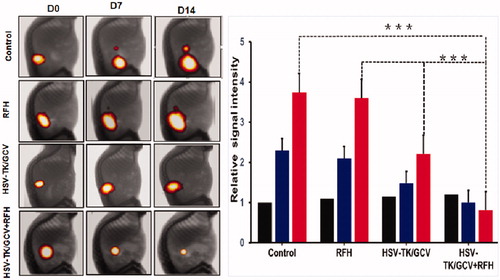
Figure 6. Ultrasound imaging follow-up of rat orthotopic ovarian tumors in four different treatment groups (PBS, RFH alone, HSV-TK/GCV alone, HSV-TK/GCV plus RFH), which demonstrated a significant decrease in tumor size for the combination therapy group compared to the other three groups (*p<.05, ***p<.001).
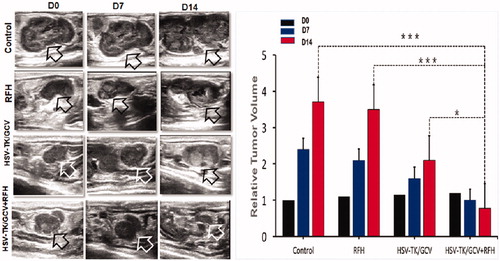
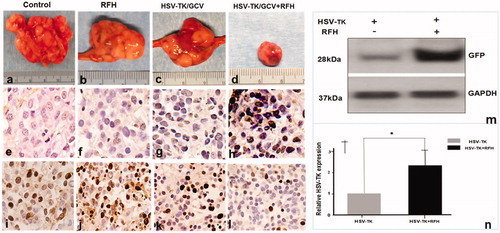
Figure 7. (a–d) Gross specimens of tumors confirmed the smallest tumor size in the combination therapy group (upper panel). (e–h) TUNEL staining for apoptosis analysis (200× magnification) showed more apoptotic cells in the combination therapy group than the other three groups. (i–l) Ki-67 staining demonstrated a substantial inhibition of cancer cell proliferation in the combination therapy group, as evidenced by the fewest number of brown-stained cells. (m, n) Western blot analysis of GFP gene expression in tumor tissues showed a greater than two-fold increase in gene expression for ovarian tumors treated with RFH enhancement compared to those treated with intratumoral lentiviral HSV-TK gene transduction alone (*p<.001).