Figures & data
Figure 1. Flow diagram of patient selection in this study. HCC: hepatocellular carcinoma; PEI: percutaneous ethanol injection; TACE: transcatheter arterial chemoembolization.
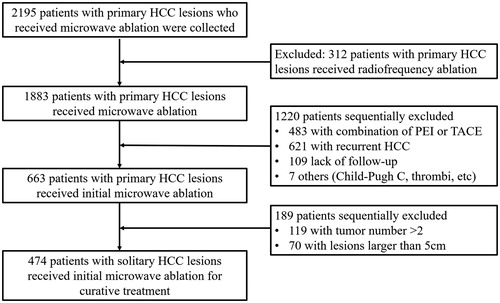
Table 1. Characteristics of included patients and univariate analysis of survival outcomes.
Figure 2. Quintiles of BMI and rates of death events (A) and disease-progression events (B).
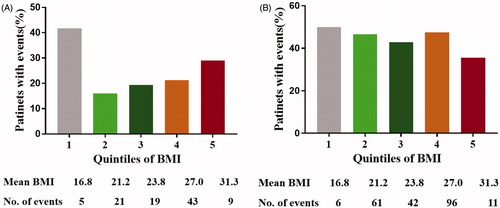
Table 2. Adjusted effects of BMI on survival results in multiple models.
Figure 3. The relationship between BMI levels and survival outcomes. (A) BMI and overall survival*; (B) BMI and disease-free survival#. *: adjusted for age, size, Charlson Score. #: adjusted for age, gender, size, Charlson Score, ALT, tumor location, NLR, platelet, MELD, Child-pugh, ALBI, cirrhosis.
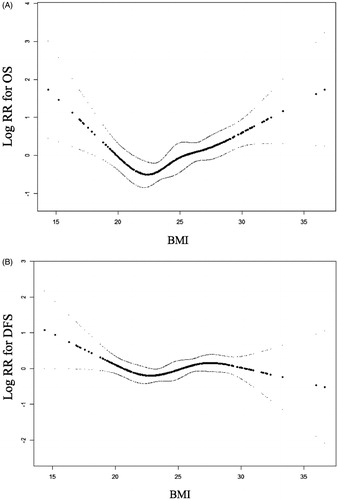
Table 3. Threshold effect analysis of BMI on overall survival by piece-wise linear regression.
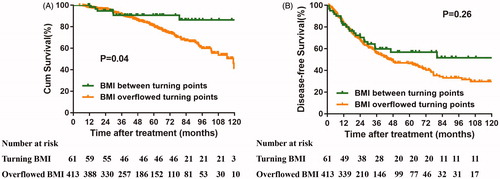
Figure 4. Comparison of OS (A) and DFS (B) in patients with BMI between turning points and BMI overflowed turning points.