
Figures & data
Figure 1. Patient enrollment process in this study.
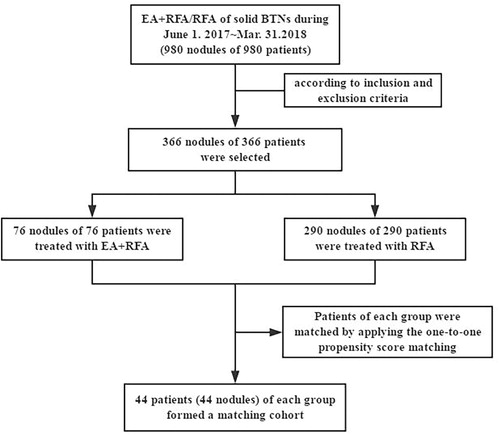
Table 1. Baseline characteristics in all study patients according to baseline nodule volume group before propensity score matching.
Table 2. Baseline characteristics in all study patients according to baseline nodule volume group after propensity score matching.
Figure 2. RFA equipment. (A) 18-gauge (diameter 1.3 mm) bipolar RFA needle (with a 15 mm active tip; (B) Olympus Surgical Technologies. RFA: radiofrequency ablation.
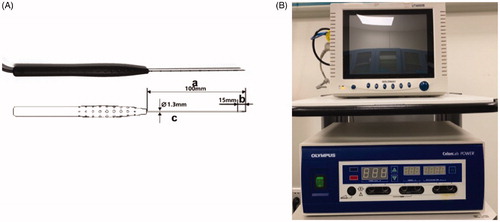
Figure 3. The ‘moving shot’ technique. The thyroid nodule (dashed oval) was divided into multiple small conceptual ablation units (small white ovals); the electrode (dashed line) was inserted into the deepest and most medial part of the nodule and was subsequently moved radially. Note the tracheal lumen (TL), dangerous triangle (D), and recurrent laryngeal nerve (N).
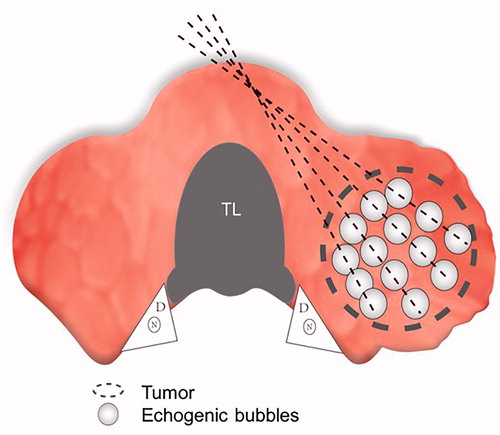
Table 3. Comprehensive satisfaction score (CSS) evaluation questionnaire.
Figure 4. Comparisons of the RFA information between the EA + RFA group and the RFA group. (A) RFA duration; (B) RFA energy; (C) RFA power. EA: ethanol ablation; RFA, radiofrequency ablation.
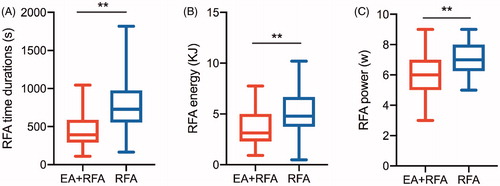
Figure 5. Changes in volume reduction ratio (VRR) of medium thyroid nodules and large thyroid nodules after RFA treatment at each follow-up. (A) VRR changes in medium nodules; (B) VRR changes in large nodules.
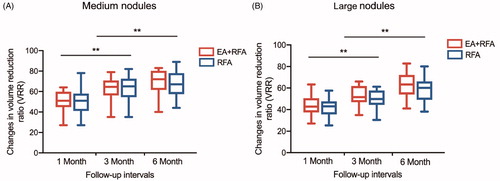
Figure 6. Images and appearance of the neck. A. Images of RFA treatment and follow-up of a thyroid nodule. (a) Conventional ultrasound image showed a solid thyroid nodule. (b) Color Doppler ultrasonography image showed abundant vascularity. (c) CEUS performed before RFA showed homogeneous hyperenhancement in the nodule (white arrows). (d) After a multisite injection of small amounts of ethanol (white arrows indicate echo-staining), RFA was performed using the moving shot technique. (e) CEUS was performed immediately after RFA and showed a complete lack of enhancement in the treated area (white arrows). (f) One month after RFA, the nodule volume (white arrows) was significantly reduced by 49.5%. (g) Three months after RFA, the nodule volume (white arrows) was significantly reduced by 76.3%. (h) Six months after RFA, the nodule volume (white arrows) was significantly reduced by 85.7%. The lesion margin is indicated by ‘+’. RFA, radiofrequency ablation; CEUS, contrast-enhanced ultrasound. B. Comparisons of the appearance of the neck before and after ablation. (a, b) A 27-year-old patient. Before RFA, a quail egg-sized nodule could be seen under the skin of the neck (black arrow), and tenderness could be felt. Three months after RFA, the thyroid nodule markedly shrunk, and no scars were left on the neck (black arrow). (c, d) A 33-year-old patient. A quail egg-sized nodule was visible under the skin of the neck (black arrow) prior to EA combined with RFA. Three months after RFA, the nodule almost disappeared, and no scars were left on the neck (black arrow).
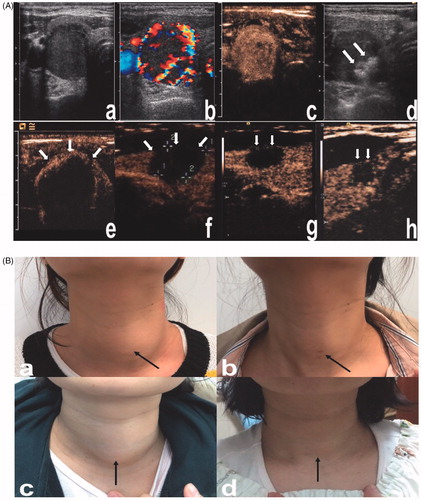
Table 4. The therapeutic success rate of the two treatment groups.
Figure 7. Changes in the symptom score (SS) and cosmetic score (CS) of patients with medium and large TNs at baseline and at the last follow-up. (A, B) The SS of patients with medium and large TNs in both groups. (C, D) The CS of patients with medium and large TNs in both groups.
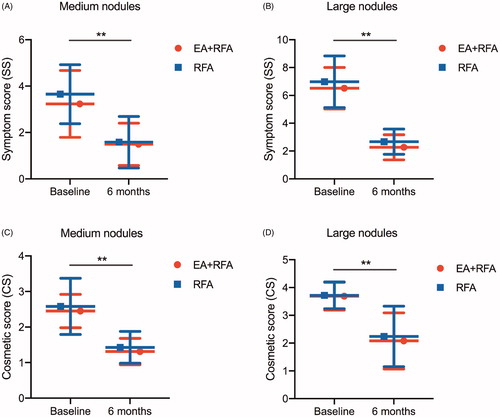
Figure 8. Changes in the comprehensive satisfaction score (CSS) of patients with medium and large thyroid nodules (TNs) in different groups at 6 months post-ablation.
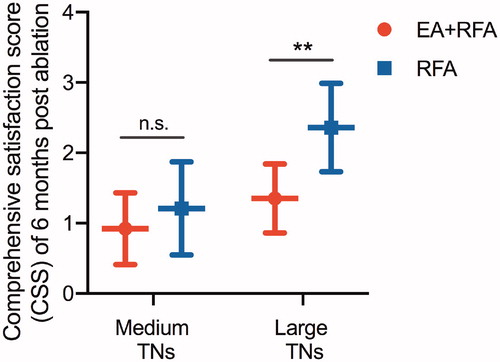
Table 5. Comparison of thyroid functions between baseline and each follow-up in both treatment groups.
Table 6. Comparisons of the complications between two treatment groups.