Figures & data
Figure 1. Study protocol.
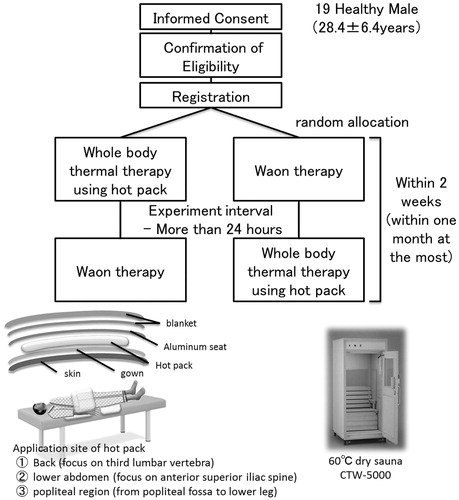
Figure 2. Tympanic temperature trends. This figure shows the trends of the tympanic temperatures every 5 min during both thermal therapies. vs. rest †p<.01; vs. WT §p<.01.
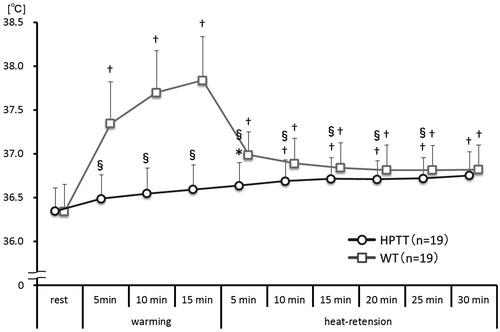
Figure 3. Blood pressure trends. This figure shows the trend of the blood pressures taken every 5 mins during both thermal therapies. No values were significantly changed.
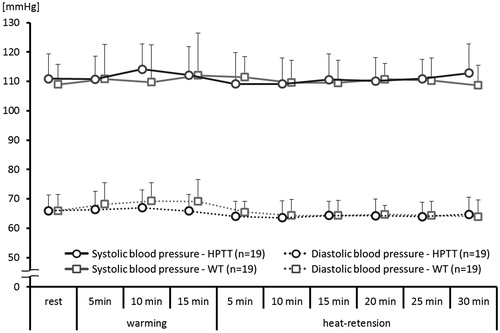
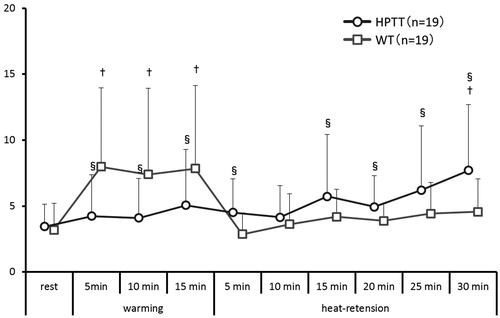
Figure 4. Heart rate trends. This figure shows the average trend of heart rates taken every 5 mins during both thermal therapies. vs. rest *p<.05; †p<.01; vs. WT §p<.01.
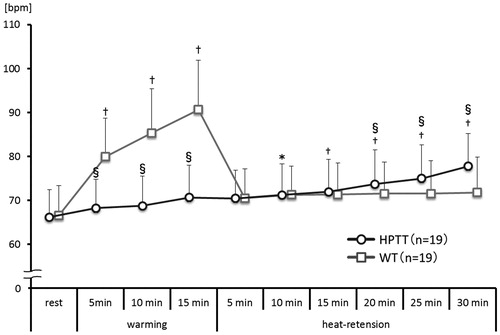
Figure 5. Right radial artery blood velocity trends. This figure shows the average trends of right radial artery peak and mean blood velocity taken every 5 minutes. vs. rest *p<.05; †p<.01; vs. WT ‡p<.05; §p<.01.
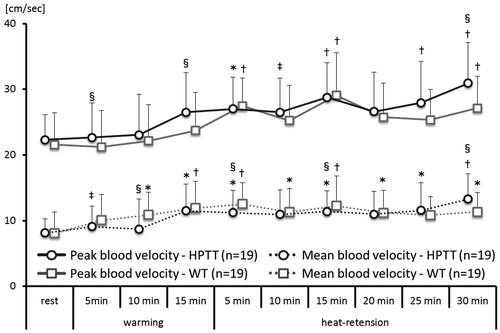
Figure 6. Right brachial artery diameter trends. This figure shows the trends of right brachial artery diameters during both thermal therapies. vs. rest †p<.01.
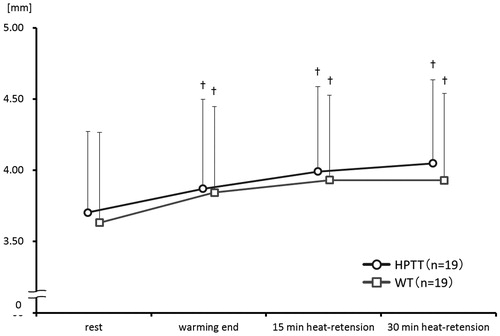
Figure 7. LF/HF trends. This figure shows the trends of LF/HF taken every during both thermal therapies. vs. rest †p<.01; vs. WT §p<.01.