1,458
Views
7
CrossRef citations to date
0
Altmetric
Original Articles

Use of intra-procedural fusion imaging combining contrast-enhanced ultrasound using a perflubutane-based contrast agent and auto sweep three-dimensional ultrasound for guiding radiofrequency ablation and evaluating its efficacy in patients with hepatocellular carcinoma

, , , , , , , & show all
Pages 202-211 | Received 16 Oct 2019, Accepted 05 Feb 2020, Published online: 18 Feb 2020

Figures & data

Figure 1. Comparison of three-dimensional ultrasound (3DUS) volume data images obtained by manual sweep scanning and AutoSweep scanning for an HCC lesion (maximum diameter, 28 mm) in segment VIII of the liver. (a) 3DUS volume data image obtained by manual sweep scanning. Blue lines indicate the locus of the manual sweep scanning. Arrow indicates the first frame of the manual sweep scanning. The distances between the blue lines are not equal, which indicates a non-constant scanning speed. (b) 3DUS volume data image obtained by manual sweep scanning. (c) 3DUS obtained by manual sweep allows viewing of the volume of interest in three orthogonal planes (this image shows plane B), which can be translated from right to left. The shape of the arc is not symmetrical due to the non-constant scanning speed (arrow). (d) US volume data image obtained by AutoSweep scanning. Comparison with the image in obtained by manual sweep shows that the images look almost the same. (e) 3DUS image obtained by AutoSweep allows viewing of the volume of interest in three orthogonal planes (this image shows plane B), which can be translated from right to left. Comparison with the image shown in obtained by manual sweep shows that the shape of the arc is symmetrical and the scanning range is slightly wider than that in the image shown in (arrow). Arrowhead indicates the margin of the HCC.

Figure 1. Comparison of three-dimensional ultrasound (3DUS) volume data images obtained by manual sweep scanning and AutoSweep scanning for an HCC lesion (maximum diameter, 28 mm) in segment VIII of the liver. (a) 3DUS volume data image obtained by manual sweep scanning. Blue lines indicate the locus of the manual sweep scanning. Arrow indicates the first frame of the manual sweep scanning. The distances between the blue lines are not equal, which indicates a non-constant scanning speed. (b) 3DUS volume data image obtained by manual sweep scanning. (c) 3DUS obtained by manual sweep allows viewing of the volume of interest in three orthogonal planes (this image shows plane B), which can be translated from right to left. The shape of the arc is not symmetrical due to the non-constant scanning speed (arrow). (d) US volume data image obtained by AutoSweep scanning. Comparison with the image in Figure 1(b) obtained by manual sweep shows that the images look almost the same. (e) 3DUS image obtained by AutoSweep allows viewing of the volume of interest in three orthogonal planes (this image shows plane B), which can be translated from right to left. Comparison with the image shown in Figure 1(c) obtained by manual sweep shows that the shape of the arc is symmetrical and the scanning range is slightly wider than that in the image shown in Figure 1(c) (arrow). Arrowhead indicates the margin of the HCC.

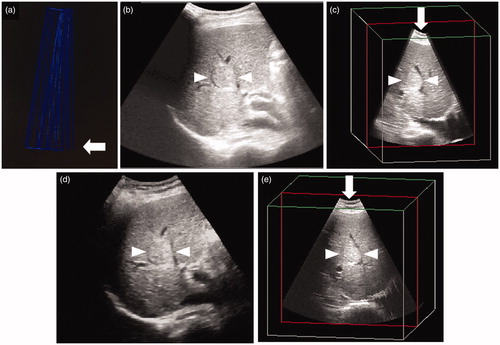
Table 1. Baseline characteristics of the patients with HCC.a,b

Table 2. Mean number of insertions for the initial RFA and additional RFA.

Figure 3. Flow chart of evaluation of therapeutic efficacy of RFA by CEUS/US fusion imaging performed during the RFA procedure.

Figure 3. Flow chart of evaluation of therapeutic efficacy of RFA by CEUS/US fusion imaging performed during the RFA procedure.

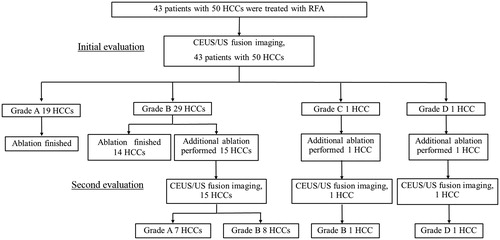
Table 3. Comparison of evaluation by CEUS-US fusion imaging and CECT/EOB-MRI for assessment of the tumor response after radiofrequency ablation in cases of hepatocellular carcinoma.