
Figures & data
Figure 1. Echopulse ® HIFU device.
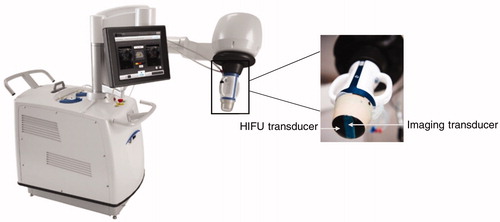
Figure 2. Longitudinal (a) and transverse (b) views of the positioning of the thermocouple TC1 in the vein. Spots are referred by their numbers.
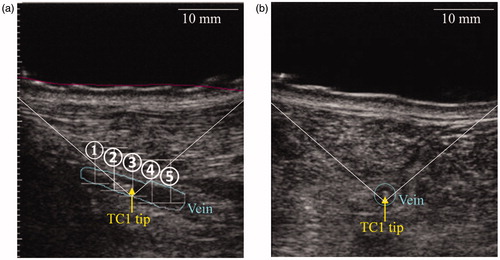
Figure 3. Illustration of the change of frame of reference with one thermocouple for sake of clarity. Delivering five pulses (①, ②, ③, ④, ⑤) at given positions (symbolized by crosses) and measuring the temperature with one thermocouple into the vein at fixed locations is considered equivalent to the virtual situation where one pulse would be delivered and five thermocouples would acquire temperatures at the same positions. On the right, TCY with Y ∈ [Citation1–5] represents a virtual thermocouple that measures the temperature rise during pulse Y.
![Figure 3. Illustration of the change of frame of reference with one thermocouple for sake of clarity. Delivering five pulses (①, ②, ③, ④, ⑤) at given positions (symbolized by crosses) and measuring the temperature with one thermocouple into the vein at fixed locations is considered equivalent to the virtual situation where one pulse would be delivered and five thermocouples would acquire temperatures at the same positions. On the right, TCY with Y ∈ [Citation1–5] represents a virtual thermocouple that measures the temperature rise during pulse Y.](/cms/asset/385b1d90-ff9c-4eaf-a0f2-ff67626efd56/ihyt_a_1734672_f0003_c.jpg)
Table 1. Clinical signs assessed after HIFU treatments.
Table 2. Maximum temperatures recorded by each thermocouple during each treatment performed in both left and right hind limb.
Figure 4. Illustration of temperature profiles measured by the thermocouple TC1 during the treatment #3 in the right vein for each of the y-locations before spatial registration (a) and example of spatial registration of the data acquired by the thermocouple TC1 during the treatment #3 (b).
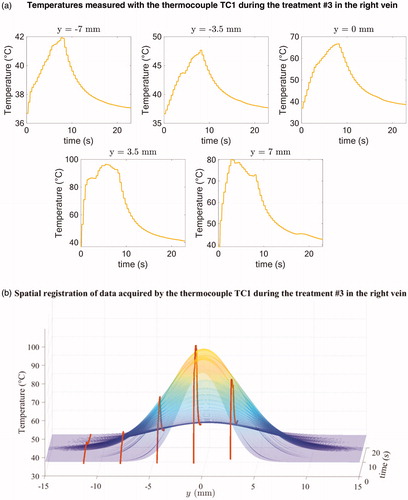
Figure 5. Estimated spatiotemporal temperature distribution for one pulse.
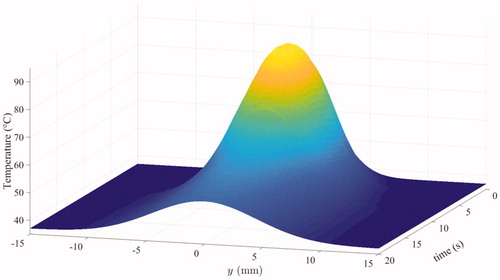
Figure 6. Spatial profile of along the vein after one pulse.
is capped to 5 since it formally corresponds to 99 % of collagen denaturation.
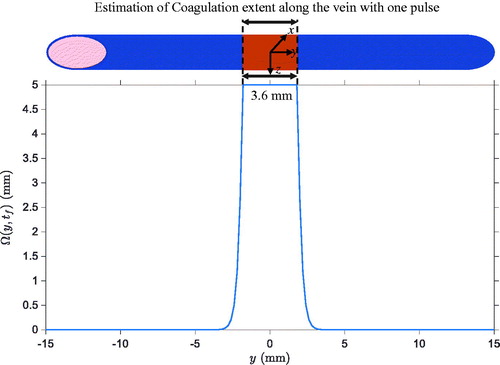
Figure 7. Ultrasound images of the lateral saphenous vein (pointed by a white arrow) of a sheep before exposure (a) and immediately after exposure (b).The exposed vein has a reduced lumen and a hyper-echoic mark (pointed by a yellow arrowhead) is visible.
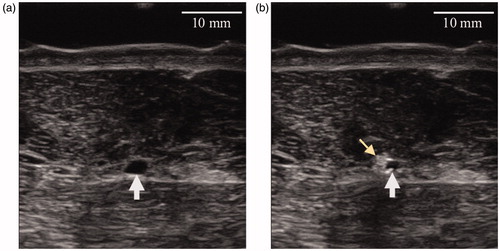
Figure 8. B-mode image after HIFU procedure showing a vein diameter constriction and blurred vascular contours.
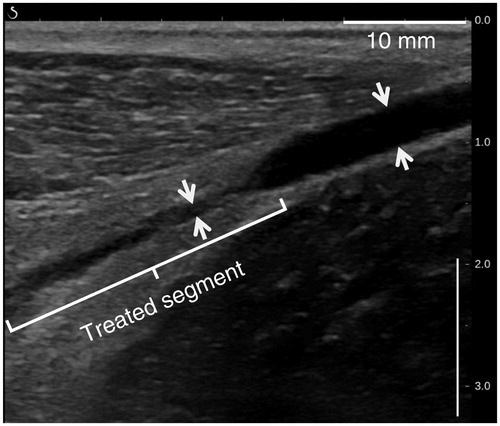
Figure 9. Ultrasound images showing a non-compressible treated vein at 30 days post-treatment (left column) and a compressible untreated vein (right column). Veins are pointed by white arrows. (a) and (b) represent respectively the sheep veins before and after external ultrasound compression.
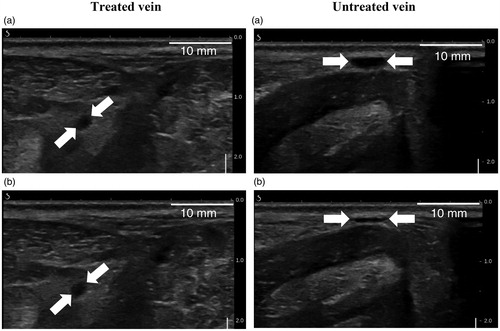
Figure 10. Color Doppler ultrasound image showing the absence of flow in a sheep vein (white arrow) 60 days after treatments.
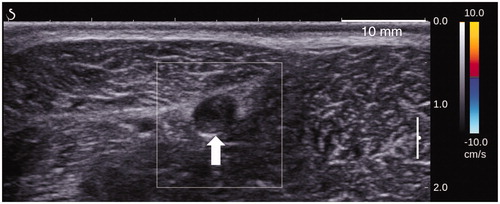
Figure 11. B-mode image of a sheep vein (white arrow) taken 90 days after sonications and showing complete fibrosis of the treated segment.
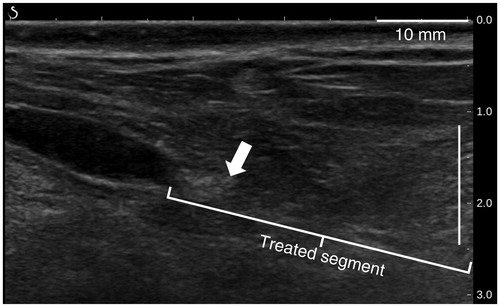
Table 3. Imaging findings synthesis.
Figure 12. Representative illustrations of HIFU lesions in vascular tissue. (a) H&E-section of a vein extracted 30 days after treatment. HIFU lesion shows vein wall hyalinization (arrows), thrombus (T) and necrotic perivascular adipose tissue (arrowheads). (b) H&E-section of a vein extracted at 60 days. Thrombus (T), fibroblast infiltration (double arrows) and residual media hyalinization (arrows) are observed. (c) GET-section of a vein extracted at 90 days and presenting fibrocellular thrombus (T), media fibrosis (arrows) and perivascular fibrosis (F).
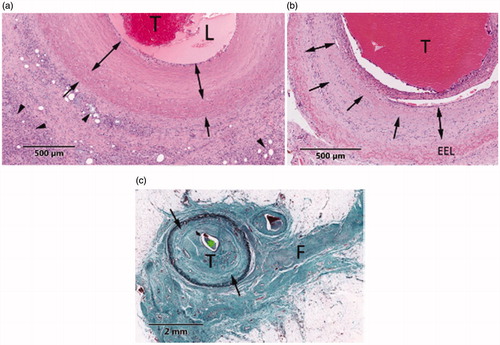
Figure 13. Typical HIFU lesions in perivenous collateral tissues. (a) GET-section of a superficial perivenous muscle extracted at 30 days; the area under the dotted line presents focal muscle necrosis with fibrosis (arrowhead) and residual necrotic muscle tissue (asterisk). (b) GET-section of a superficial perivenous muscle harvested 60 days post-treatment (GET); the area above the dotted line shows necrosis and regeneration with fibrosis in the muscle.
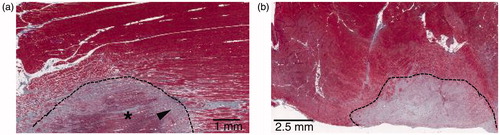
Table 4. Histopathological findings synthesis.
Table 5. Vascular thermal damage computed for different exposure parameters reported in the studies conducted by Martinot el al. [Citation25] and Fujiwara et al. [Citation27].
Figure 14. Illustration of the spatial registration process.
