
Figures & data
Figure 1. Flow diagram outlining article selection process. Article may had been excluded for multiple reasons, but only one major reason per article was presented.
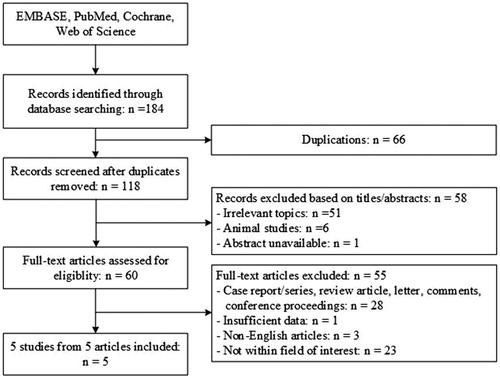
Table 1. Characteristics of the included studies.
Figure 2. Forest plot and meta-analysis of comparison between PTH levels at 3 months after ablation and that of pre-ablation (a), and funnel plot for change of PTH levels at 3 months after thermal ablation (b). PTH: parathyroid hormone.
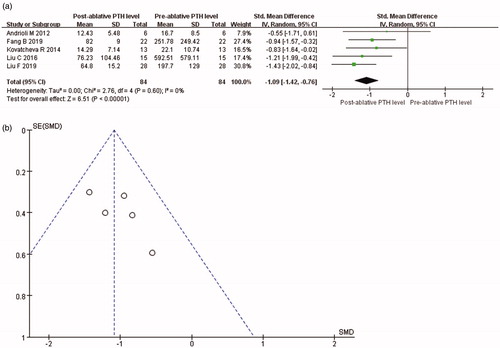
Figure 3. Forest plot and meta-analysis of comparison between PTH levels at 6 months after ablation and that of pre-ablation (a), and funnel plot for change of PTH levels at 6 months after thermal ablation (b). PTH: parathyroid hormone.
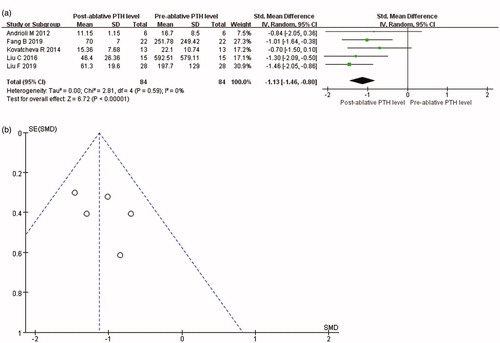
Figure 4. Forest plot, meta-analysis of comparison between serum calcium levels at 3 months after ablation and that of pre-ablation.
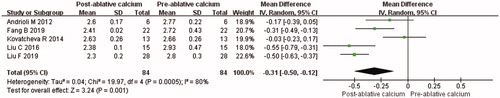
Figure 5. Forest plot and meta-analysis of comparison between serum calcium levels at 6 months after ablation and that of pre-ablation.

Figure 6. Forest plot and meta-analysis of comparison between volume of parathyroid gland at 6 months after ablation and that pre-ablation.
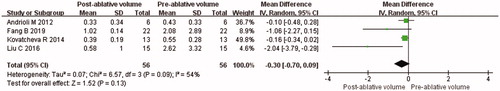
Table 2. Publication bias analyses with Egger’s test based on primary outcomes.