
Figures & data
Figure 1. Physiological parameters measuring including rectal temperature, systolic pressure, diastolic pressure, heart rate, and respiration rate in the environmental chamber and MRI scanning.
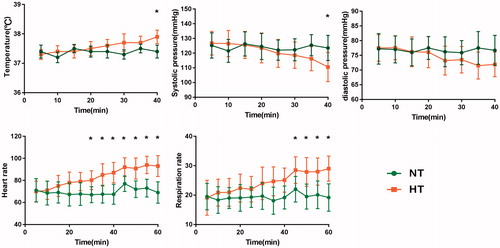
Figure 2. Spatial FC patterns within both attention networks. (a-b) Within-group t maps of the DAN under HT and NT conditions. (c-d) Within-group t maps of the VAN under HT and NT conditions.
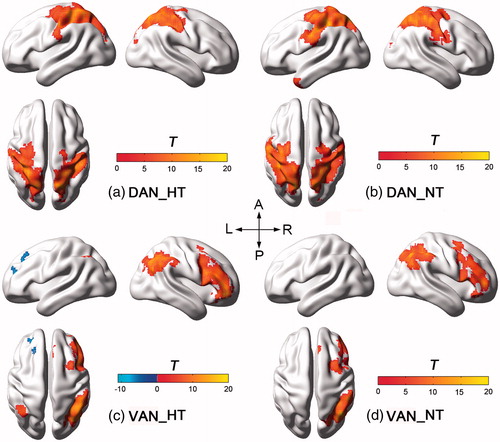
Figure 3. Between-condition comparisons on the FC and CBF in the DAN and VAN. The t map of the FC (a) and CBF (c) in the DAN, and the overlapped regions between them (b). The t map of the FC (d) and CBF (f) in the VAN, and the overlapped regions between them (e).
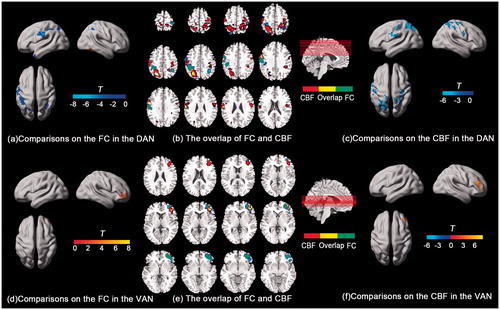
Figure 4. Between-condition comparisons on the CBF-FC correlations within the selected ROIs. (a) Decreased CBF-FC correlation in the right FEF area in the DAN. (b) Decreased CBF-FC correlation in the left FEF area in the DAN.(c) Maintained CBF-FC correlation in the left postcentral gyrus, and superior/inferior parietal lobule in the DAN.(d) Maintained CBF-FC correlation in the right postcentral gyrus in the DAN. (e) Increased CBF-FC correlation in the right VFC area in the VAN. (d) Maintained CBF-FC correlation in the right TPJ area in the VAN.
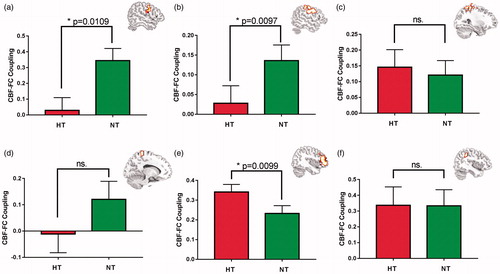
Figure 5. Spatial distributions and the number of voxels with significant CBF-FC correlations (p < 0.01, two-tailed). The left histograms represented the number of voxels with negative and positive correlations. (a) Significant negative CBF-FC correlation in the right postcentral gyrus and superior parietal lobule, positive one in right precentral gyrus, within the DAN under HT condition. (c) Positive CBF-FC correlation in the left parietal lobe, including postcentral gyrus, superior parietal lobule and inferior parietal lobule, within the DAN under NT condition. (b)/(d) Positive correlation located in right VFC and TPJ areas within the VAN under HT and NT conditions.
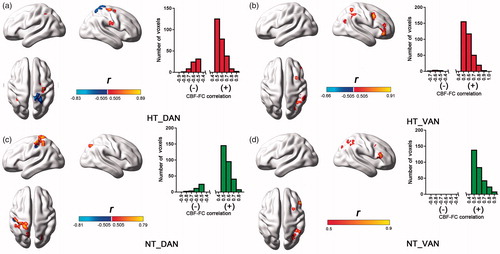
Figure 6. Between-condition t maps of the CBF/FC ratio within the DAN (a) and VAN (b).
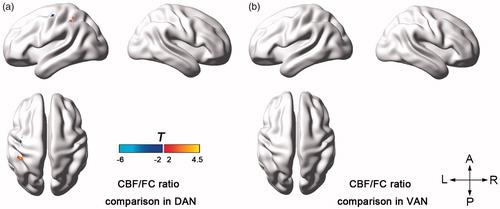
Table 1. Multivariate linear regression analyses of contributions of neuroimaging metrics in six ROIs to attention performances.