
Figures & data
Figure 1. Flow diagram of the study cohort.
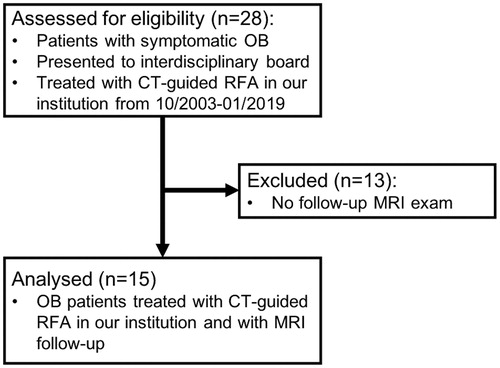
Table 1. Data overview of the study group.
Table 2. MRI protocol for osteoblastoma examinations in our department.
Figure 2. Graphical illustration of the imaging patterns of osteoblastoma after ablation. The linear black and gray pattern represents edema or enhancement. The white signal represents normal bone marrow signal. CNE: central nidus enhancement; PNE: peripheral nidus enhancement; PBME: perifocal bone marrow edema; FNC: fatty nidus conversion.
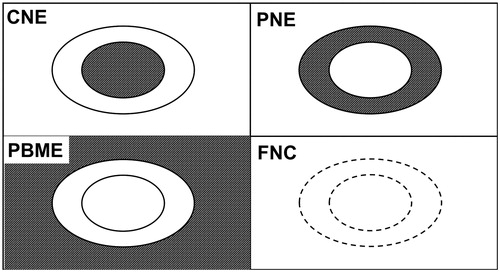
Figure 3. Images of an 8-year-old female with a successfully treated osteoblastoma of the left acetabulum. (a) Axial T1-weighted fat-saturated contrast-enhanced image taken at the time of diagnosis showing strong enhancement of the nidus (thick arrow) with extensive perifocal edema. (b) Axial reformation of the CT scan taken during the RFA procedure showing the needle tip in the nidus. (c–e) Follow-up axial T1-weighted fat-saturated contrast-enhanced images taken at 4, 9 and 21 months post-RFA. (c, d) A target-like appearance (thin arrows) is seen after 4 and 9 months. (e) Disappearance of the peripheral nidus enhancement and perifocal edema after 21 months. (f, g) Follow-up coronal T1-weighted images taken at 4 and 21 months post-RFA showing fatty conversion of the nidus (arrowheads) over this period. RFA: radiofrequency ablation.
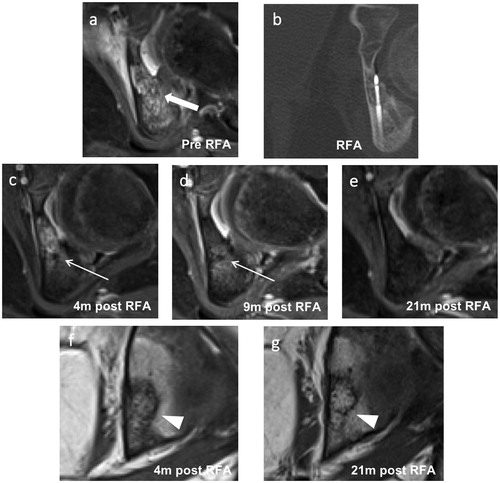
Figure 4. Images of a 10-year-old male with a successfully treated osteoblastoma of the right sacrum. (a) Axial short tau inversion recovery image taken before RFA showing a hyperintense nidus (thick arrow) with extensive perifocal edema. (b) Axial reformation of the CT scan taken during the RFA procedure showing the RFA needle tip in the nidus and an epidural needle for thermal protection. (c, d) Follow-up axial T1-weighted fat-saturated contrast-enhanced images taken at 1 and 16 months post-RFA. (c) A typical post-RFA pattern of a target-like appearance (thin arrow) is seen after 1 month. (e) Disappearance of the peripheral nidus enhancement (arrowhead) and perifocal edema after 16 months. (f) Follow-up coronal T1-weighted images of the same MRI as in (e) taken 16 months after RFA showing fatty conversion of the nidus (arrowhead). RFA: radiofrequency ablation.
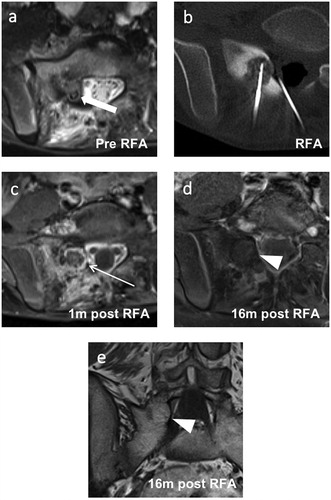
Table 3. Morphological follow-up MRI pattern of successfully treated osteoblastoma patients.
Figure 5. Images of a 16-year-old male with a recurrent osteoblastoma of the right humerus. (a) Coronal reformation of a CT scan performed at the time of diagnosis. (b) Axial T2-weighted fat-saturated image taken at the time of the second clinical recurrence showing extensive perifocal bone marrow edema and the former drilling channel (thick arrow) located cranially and laterally to the recurrent active nidus. (c) Coronal T1-weighted fat-saturated contrast-enhanced image of the same exam as in (b) showing strong contrast enhancement of the central nidus (arrowhead). (d) Coronal reformation of a CT scan performed at the time of the second recurrence showing an active centrally mineralized nidus (arrowhead) in the cranial segment of the initial osteoblastoma. (e, f) Coronal and axial T1-weighted fat-saturated contrast-enhanced images taken 3 months after the third RFA. A typical target-like appearance is seen with a non-enhanced central nidus surrounded by an enhanced peripheral nidus (thin arrows). Only a small degree of perifocal bone marrow edema is visible. RFA: radiofrequency ablation.
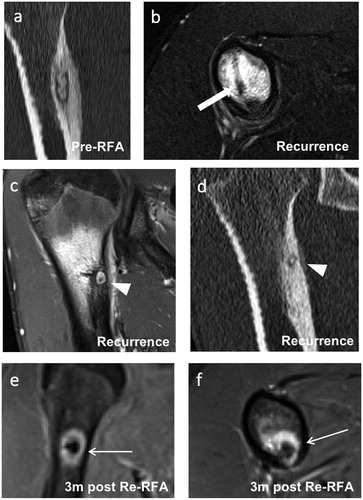
Table 4. Morphological follow-up MRI pattern at the time of clinical osteoblastoma recurrence after RFA.