1,879
Views
7
CrossRef citations to date
0
Altmetric
Research Article

Hyperthermic intraperitoneal chemotherapy enhances blood coagulation perioperatively evaluated by thromboelastography: a pilot study

ORCID Icon, , , , , & show all
Pages 293-300 | Received 09 Oct 2019, Accepted 28 Feb 2020, Published online: 24 Mar 2020

Figures & data

Table 1. Patient and operation characteristics.

Figure 1. (a) The individual changes of TEG parameters reaction time (R, min); (b) maximum amplitude (MA, mm). Dashed line represents the median values. (Ptime for the change over study period).

Figure 1. (a) The individual changes of TEG parameters reaction time (R, min); (b) maximum amplitude (MA, mm). Dashed line represents the median values. (Ptime for the change over study period).

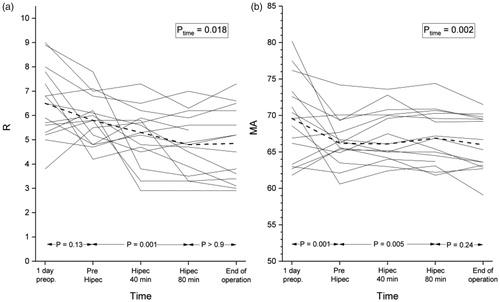
Table 2. Mean values with standard deviation (SD) and median of TEG parameters during the study period.

Table 3. Mean change of tests between time points with 95% confidence interval (95% CI).