
Figures & data
Figure 1. Patient selection flowchart. BCLC: Barcelona Clinic Liver Cancer; TACE: transarterial chemoembolization; MWA: microwave ablation; HAIC: hepatic artery infusion chemotherapy.
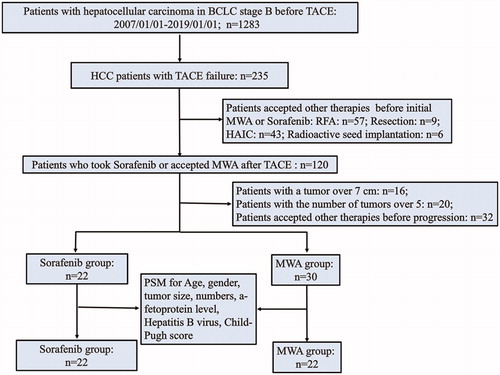
Figure 2. Images in a 64 year-old male patient with BCLC stage B hepatocellular carcinoma (HCC) before TACE, who has two lesions measuring approximately 6.1 cm and 1.0 cm (no shown), show microwave ablation (MWA) as first-line treatment after transarterial chemoembolization (TACE) refractoriness. (A) Arterial-phase CT image obtained about one month after first TACE shows that necrotic volume is less than 20% of large lesion, and small lesion disappears (no shown). (B) He underwent CT-guided multiple-position MWA for non-necrotic areas of large lesion with the output of 60 W for 69 min in total. (C) Arterial-phase CT image obtained about 1 month after MWA shows that complete ablation was achieved. (D) Arterial-phase MRI image obtained about 34 months after MWA (5 December 2019) shows no tumor recurrence.
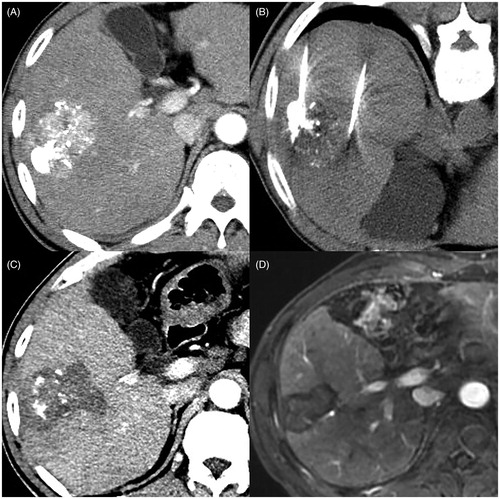
Table 1. Baseline Characteristics of patients before and after Propensity Score Matching (PSM).
Figure 3. Kaplan-Meier curves of overall-all survival (OS) and progression-free survival (PFS) in patents who took Sorafenib or accepted microwave ablation (MWA) before one-to-one PSM (Sorafenib-group: n = 22; the median OS, 16.6 months; 95% CI: 13.4–19.8 months). MWA-group: n = 30; the median OS, 48.8 months; 95% CI: not available. p = .001) (A) and (Sorafenib-group: n = 22; the median PFS, 2.8 months; 95% CI: 1.2–4.4 months. MWA group: n = 30; the median PFS, 9.3 months; 95% CI: 0.0–27.2 months. p = .001) (C), respectively. After one-to-one PSM, Kaplan-Meier curves of overall-all survival (OS) and progression-free survival (PFS) in patents who took Sorafenib or accepted microwave ablation (MWA) (Sorafenib-group: n = 22; the median OS, 16.6 months; 95% CI: 13.4–19.8 months. MWA-group: n = 22; the median OS, Not reached; 95% CI: not available. p = .001) (B) and (Sorafenib group: n = 22; the median PFS, 2.8 months; 95% CI: 1.2–4.4 months. MWA group: n = 22; the median PFS, 9.0 months; 95% CI: 6.6–11.4 months. p = .006) (D), respectively.
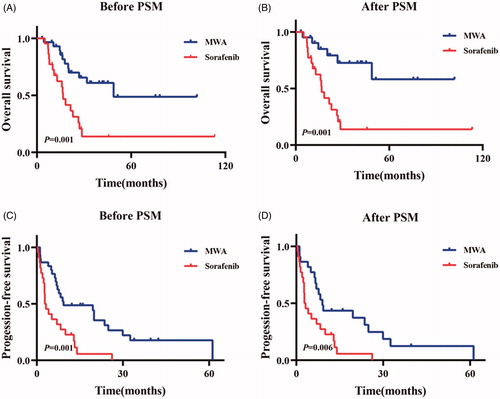
Table 2. Univariate and Multivariate analysis of OS in the enrolled cohort.
Table 3. Univariate and Multivariate analysis of PFS in the enrolled cohort.
Data availability
The datasets used and analyzed in the current study are available from the corresponding author on reasonable request.