
Figures & data
Figure 1. Sagittal view of MR images obtained from a 41-year-old patient with uterine fibroids before and 1 day after HIFU treatment. (A) Pre-HIFU T2WI image showed normal signal intensity in lumbar vertebrae (arrow); (B) Post-HIFU T2WI image showed a sheet-like hypointense area in the vertebrae of lumbar 5 (arrow); (C) Pre-HIFU contrast-enhanced image showed normal enhancement in the vertebrae of lumbar 5 (arrow); (D) Post-HIFU contrast-enhanced image showed a partial perfusion area corresponds to the hypointense area in the vertebrae of lumbar 5 on post-HIFU T2WI (arrow).
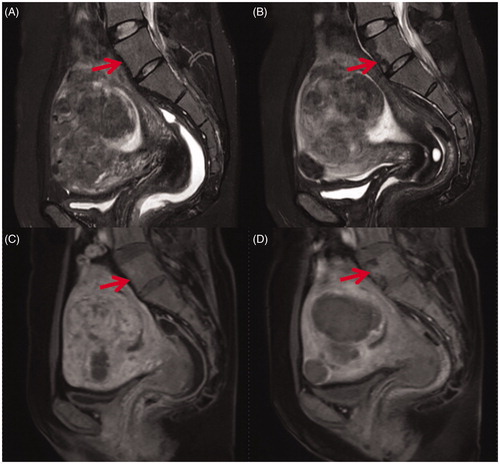
Figure 2. Transverse view of T2WI and contrast enhanced MR images obtained from a 47-year-old patient with uterine fibroids before and 1 day after HIFU. (A) Pre-HIFU T2WI image showed no abnormal signal intensity in the soft tissue adjacent to the fibroid (arrow); (B) Post-HIFU T2WI image showed a hyperintense area in the right piriformis (arrow); (C) Pre-HIFU contrast-enhanced image showed normal enhancement in the in the right piriformis (arrow); (D) Post-HIFU contrast-enhanced image showed a decreased perfusion in the area corresponds to the hyperintense area in the right piriformis on post-HIFU T2WI compared with pre-HIFU contrast-enhanced image (arrow).
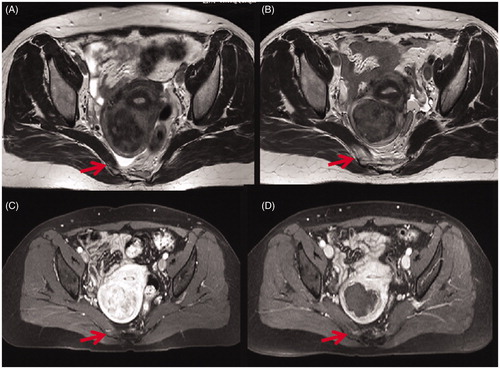
Figure 3. Transverse section through 2nd sacral vertebrae of MR images obtained from a 43-year-old patient with uterine fibroids before and 1 day after HIFU. (A) Pre-HIFU T2WI showed normal signal intensity in the sacrum and the soft tissue adjacent to the sacrum; (B) Post-HIFU T2WI showed a sheet-like hyperintense area in the sacrum and the soft tissue anterior to the sacrum (arrows); (C) Pre-HIFU contrast-enhanced image showed normal perfusion in the sacrum and the soft tissue adjacent to the sacrum; (D) Post-HIFU contrast-enhanced image showed no perfusion in the area corresponds to the signal changed area in the sacrum and the soft tissue adjacent to the sacrum on post-HIFU T2WI (arrows).
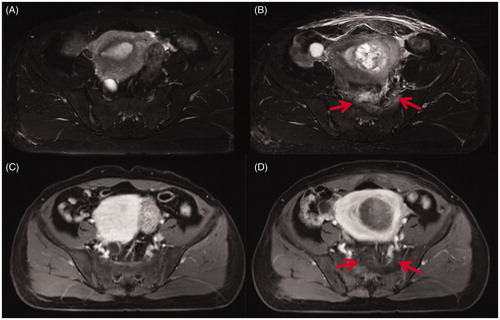
Table 1. Baseline characteristics of patients with or without MR signal changes in the sacrum and/or soft tissue adjacent to the sacrum.
Table 2. Comparison of HIFU treatment parameters between patients with and without MR signal changes in the sacrum and soft tissue adjacent to the sacrum.
Table 3. Binary logistic regression analysis to evaluate related factors to the MR signal intensity changes in the sacrum and the soft tissue adjacent to the sacrum.
Table 4. Comparison of the fibroids and baseline characteristics of patients with MR signal intensity changes in the sacrum and/or the soft tissue adjacent to the sacrum after HIFU.
Table 5. Comparison of HIFU treatment results of patients with MR signal changes in the sacrum and/or the soft tissue adjacent to the sacrum.
Table 6. Multivariate logistic regression analysis results of the factors affecting MR signal intensity changes in the sacrum and/or the soft tissue adjacent to the sacrum.
Table 7. Comparison of the signal intensity change volume between patients with sacral pain and those without sacral pain.