Figures & data
Figure 1. Flow diagram. Search and selection process for clinical trials.
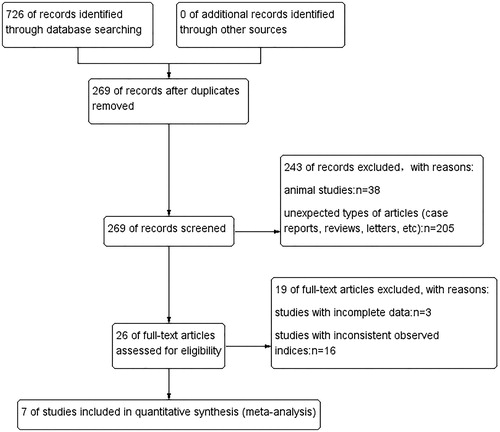
Table 1. Characteristics of the included studies.
Table 2. Patients’ characteristics at baseline.
Table 3. Risk of bias of randomized controlled trial.
Table 4. Quality assessment of cohort studies.
Figure 2. (A) Forest plot of hoarseness. Forest plot of hoarseness analyzed by odds ratio (OR) with 95% confidence intervals. The size of the data markers indicates the weight in the analysis. (B) Forest plot of hypothyroidism. Forest plot of hypothyroidism analyzed by risk difference (RD) with 95% confidence intervals. The size of the data markers indicates the weight in the analysis. (C) Forest plot of postoperative pain. Forest plot of postoperative pain analyzed by odds ratio (OR) with 95% confidence intervals. The size of the data markers indicates the weight in the analysis.
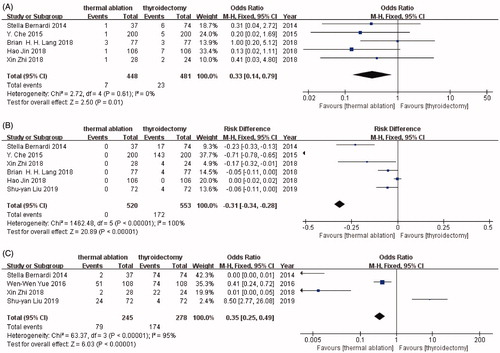
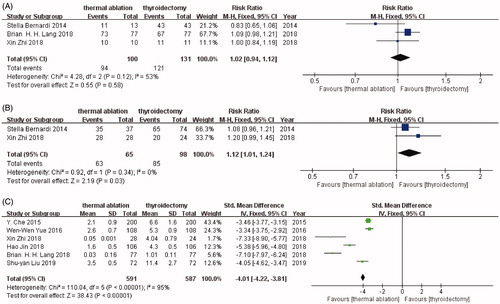
Figure 3. (A) Forest plot of symptom improvement. Forest plot of symptom improvement analyzed by relative risk (RR) ratio with 95% confidence intervals. The size of the data markers indicates the weight in the analysis. (B) Forest plot of postoperative cosmetic effect. Forest plot of postoperative cosmetic effect analyzed by relative risk (RR) ratio with 95% confidence intervals. The size of the data markers indicates the weight in the analysis. (C) Forest plot of hospitalization time. Forest plot of hospitalization time analyzed by standard mean difference (SMD) with 95% confidence intervals. The size of the data markers indicates the weight in the analysis.