Figures & data
Figure 1. Statistical analysis of the conventional ultrasound classification of preoperative uterine fibroids.
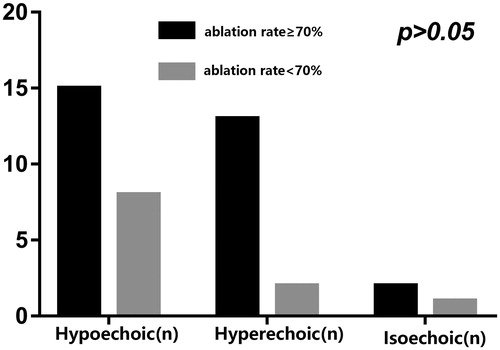
Table 1. Conventional ultrasound classification of preoperative uterine fibroids.
Figure 2. SWV values of preoperative uterine fibroids.
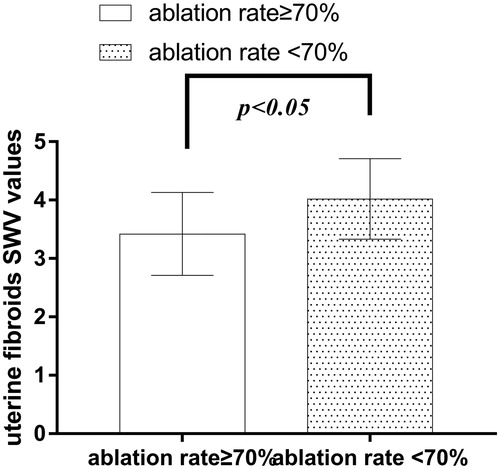
Figure 3. The SWV values, VTI grades, and enhanced MRIs of preoperative uterine fibroids. (A) Preoperative fibroid with SWV values of 4.28 m/s and an ablation rate < 70%. (B) Preoperative fibroid with VTI grade Ⅵ and ablation rate < 70%. (C) Enhanced MRI showing residual mass with an ablation rate <70%. (D) Preoperative fibroid with SWV value of 2.70 m/s and ablation rate ≥70%. (E) Preoperative fibroid with VTI grade II and ablation rate ≥70%. (F) Enhanced MRI showing no residual mass.
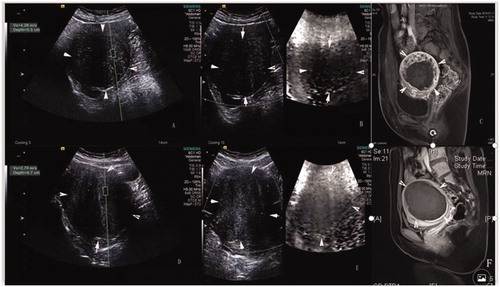
Figure 4. Statistical chart of preoperative uterine fibroids VTI grade in the two groups.
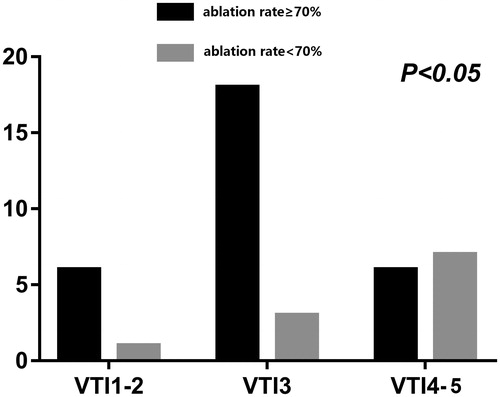
Table2. Comparative of preoperative uterine fibroids VTI grade in the two groups.
Figure 5. The correlation between HIFU ablation rate and preoperative fibroids’ SWV values and VTI grades.
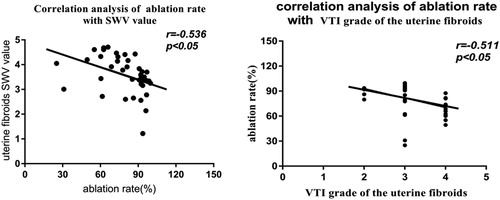
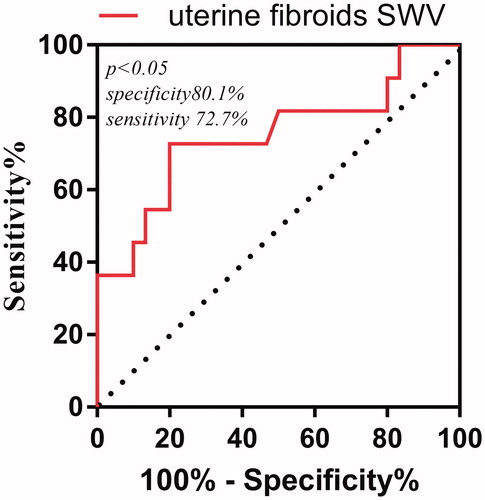
Figure 6. Receiver operating characteristic (ROC) curve of preoperative fibroids’ SWV value to predict HIFU ablation rate < 70%.