
Figures & data
Figure 1. (a) Open ablation via laparotomy along the right costal arch. A plastic sleeve (S), placed over the antenna (A) shaft, was used to mark the ablation. After MWA, the plastic sleeve was advanced (dashed arrow) into the liver tissue (L) exactly to the center of the ablation. (b) Ablations were cut at the tip and perpendicular to the plastic sleeve (S) with the help of a custom-made aiming device. This experimental setting ensured an exact and reproducible evaluation of ablations.
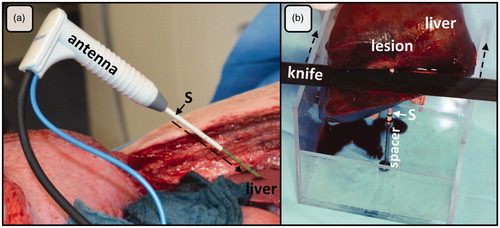
Figure 2. MWA were cut orthogonally to the antenna through the center of the ablation. The figure shows the corresponding cross sections: (a) histology (NADH-staining), (b) macroscopy and (c) CECT-imaging. (d) A chromatic visualization of the histological cross sections was performed with an image analysis software in order to identify different ablation zones. (e) three different ablation zones could be identified macroscopically (mWZ, mRZ1 and mRZ2). (f) A single MWA zone could be identified around the antenna (tissue with lower density compared to native liver tissue). A small hyperdense margin was seen around the ablations (arrows). A: antenna; V: hepatic vein.
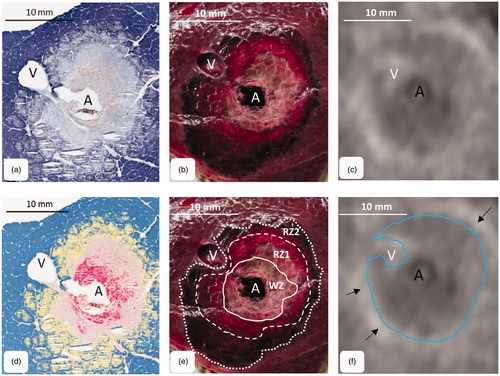
Figure 3. Comparison of histological, macroscopic area and CECT. While CECT overestimated hWZ and hRZ1, CECT most likely correlated with hRZ2 (**p < = .01; n.s.: not significant).
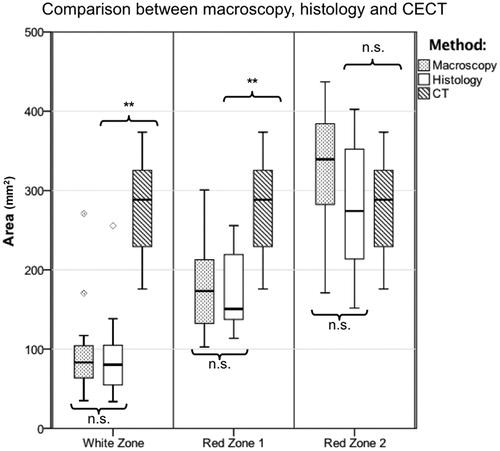
Table 1. Median (minimum–maximum) radii and ablation areas for histology, macroscopy and CT (n = 11 ablations).