Figures & data
Figure 1. HS-induced RIPK1/RIPK3-dependent necroptosis activation in vivo. (A) The temperature rise curve of mice subjected to HS. Mice were exposed to a temperature controlled chamber (ambient temperature 35.5 ± 0.5 °C and 60 ± 5% relative humidity) until rectal core temperature (Tc) reached 42 °C. (B) Mice were exposed to a temperature controlled chamber (ambient temperature 35.5 ± 0.5 °C and 60 ± 5% relative humidity) until Tc reached 42 °C. The mice were sacrificed at 20 h after HS exposure and the small intestine (ileum) was isolated. RIPK1, RIPK3, phosphorylated MLKL, and MLKL levels were detected by Western blot. (C) Mice were exposed to a temperature controlled chamber (ambient temperature 35.5 ± 0.5 °C and 60 ± 5% relative humidity) until rectal core temperature (Tc) reached 42 °C. The mice were sacrificed at 20 h after HS exposure and the small intestine (ileum) was isolated. RIPK1-RIPK3 complexes were measured by immunoprecipitation assay with IgG serving as the negative control. (D) Mice were pretreated with or without 1.8 mg/kg Nec-1 or 1.9 mmol/kg GSK’ 872 (intraperitoneal) at 1 h, followed by exposure to a temperature-controlled chamber (ambient temperature 35.5 ± 0.5 °C and 60 ± 5% relative humidity) until Tc reached 42 °C. The mice were sacrificed at 20 h after HS exposure and the small intestine (ileum) was isolated. RIPK1, RIPK3, phosphorylated MLKL, and MLKL levels were detected by Western blot, (n = 6).
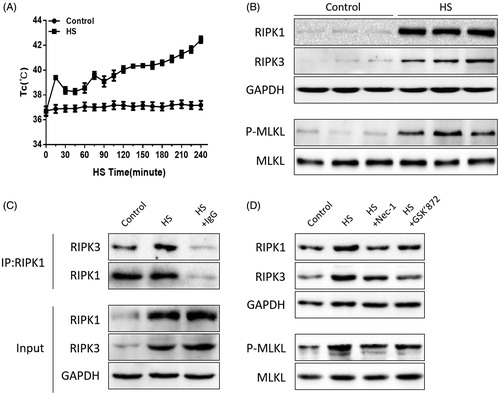
Figure 2. HS-induced RIPK1/RIPK3-dependent necroptosis activation in IEC-6 cells. (A) IEC-6 cells underwent HS (37 °C, 39 °C, 41 °C, 43 °C, or 45 °C) for 2 h and were then further incubated at 37 °C for 24 h; IEC-6 cells were subsequently exposed to HS at 43 °C for 2 h and were further incubated at 37 °C for different time increments (1 h, 6 h, 12 h, 24 h and 48 h). Cell viability percentage was measured by WST-1. (B) IEC-6 cells underwent HS (43 °C) for 2 h and were further incubated at 37 °C for 24 h. RIPK1, RIPK3, phosphorylated MLKL and MLKL levels were detected by Western blot. (C) IEC-6 cells underwent HS (43 °C) for 2 h and were further incubated at 37 °C for 24 h. RIPK1-RIPK3 complexes were measured by immunoprecipitation assay with IgG serving as the negative control. (D) IEC-6 cells were pretreated with or without 20 μM Nec-1 or 10 μM GSK’ 872, then underwent HS (43 °C) for 2 h and were further incubated at 37 °C for 24 h. RIPK1, RIPK3, phosphorylated MLKL, and MLKL levels were detected by Western blot. The data shown represent the mean ± SD from at least three independent experiments, performed in triplicate.
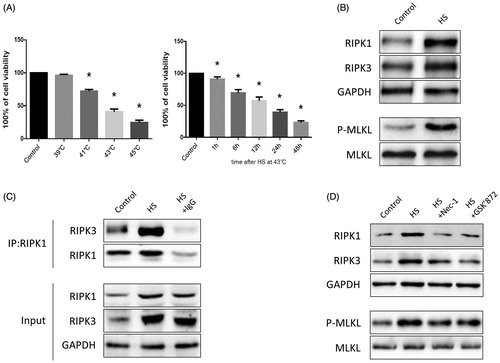
Figure 3. Nec-1 or GSK’872 pretreatment reduced cell injury and death induced by HS. IEC-6 cells were pretreated with or without 20 μM Nec-1 or 10 μM GSK’ 872 then underwent HS (43 °C) for 2 h and were further incubated at 37 °C for 24 h. (A) Cell viability percentage was measured by WST-1. (B) The folds of cell death were detected by LDH release assays. (C) Induction of HS-induced cell death was analyzed by flow cytometry with Annexin V-FITC/PI staining. (D) Quantification of the apoptotic cell percentages induced by HS analyzed by flow cytometry with Annexin V-FITC/PI staining. (E) Quantification of the necrotic cell percentages induced by HS analyzed by flow cytometry with Annexin V-FITC/PI staining. The data represent the mean ± SD of at least three independent experiments performed in triplicate. *p < 0.05 compared to the control (37 °C) group; #p < 0.05 compared to the HS (43 °C) group.
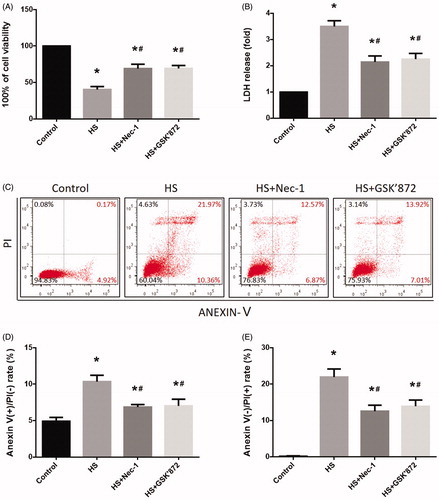
Figure 4. Nec-1 or GSK’872 pretreatment reduced HS-induced mitochondrial ROS production and promoted MMP recovery. IEC-6 cells were pretreated with or without 20 μM Nec-1 or 10 μM GSK’ 872, then underwent HS (43 °C) for 2 h and were further incubated at 37 °C for 24 h. (A) Cells were treated with 4 µM MitoSOX for mitochondrial superoxide detection. Flow cytometry was used to analyze HS-induced mitochondrial superoxide. (B) Quantification of the mitochondrial superoxide induced by HS. (C) Quantification of the malondialdehyde (MDA) levels induced by HS. (D) Quantification of the superoxide dismutase (SOD) levels induced by HS. (E) Cells were labeled with 5 µmol/L JC-1. Flow cytometry was used to analyze HS-induced mitochondrial depolarization (low ΔΨm). (F) Quantification of the low ΔΨm percentage induced by HS analyzed by flow cytometry. The data shown represent the mean ± SD from at least three independent experiments performed in triplicate. *p < 0.05, compared to the control (37 °C) group; #p < 0.05, compared to the HS (43 °C) group.
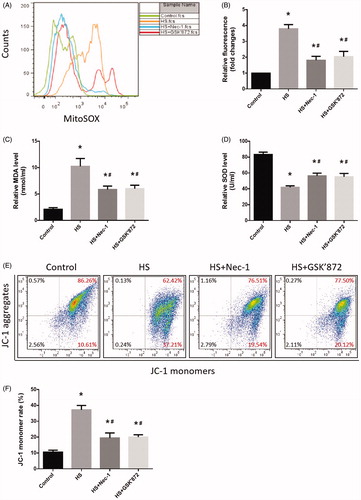
Figure 5. Nec-1 or GSK’872 pretreatment reduced HS-induced intestinal injury in vivo. Mice were pretreated with or without 1.8 mg/kg Nec-1 or 1.9 mmol/kg GSK’ 872 (intraperitoneal) at 1 h followed by exposure to a temperature controlled chamber (ambient temperature 35.5 ± 0.5 °C and 60 ± 5% relative humidity) until rectal core temperature (Tc) reached 42 °C. The mice were sacrificed at 20 h after HS exposure and the small intestine (ileum) was isolated. (A) Histopathology changes in the ileum were detected by H&E staining (magnification, ×200). HS resulted in profound damage to the small intestine epithelium, manifested as villous stroma broadening, focal necrosis, and some epithelial cell detachment accompanied by marked edema and congestion (A-b, black arrows). (B) Intestinal injury was evaluated by Chiu scores in mice. (C) The ileum ultrastructure was observed by TEM. Changes in microvillus height (C-b, red arrows), and mitochondria (C-b, blue arrows) were apparent in the HS group ileum. (D) Quantification of the malondialdehyde (MDA) levels induced by HS. E. Quantification of the superoxide dismutase (SOD) levels induced by HS. *p < 0.05, compared to the control (37 °C) group; #p < 0.05, compared to the HS group, (n = 6).
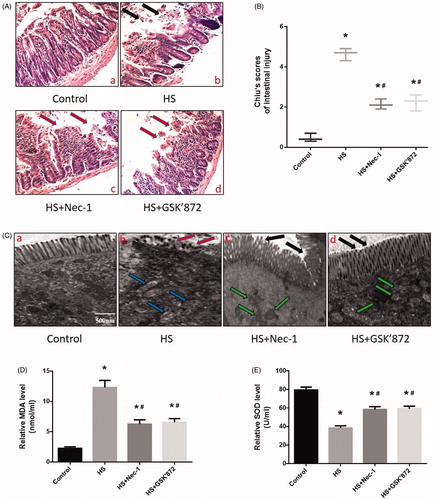
Figure 6. Scavenging ROS production relieved HS-induced RIPK1/RIPK3-dependent IEC-6 cells injury and death. IEC-6 cells were pretreated with or without 2 mM NAC, then underwent HS (43 °C) for 2 h and were further incubated at 37 °C for 24 h. (A) RIPK1, RIPK3, phosphorylated MLKL, and MLKL levels were detected by Western blot. (B) RIPK1-RIPK3 complexes were measured by immunoprecipitation assay with IgG serving as the negative control. (C) Cell viability percentages were measured by WST-1. (D) The folds of cell death were detected by LDH release assays. (E) Induction of HS-induced cell death was analyzed by flow cytometry with Annexin V-FITC/PI staining. (F) Quantification of the apoptotic cells percentage induced by HS analyzed by flow cytometry with Annexin V-FITC/PI staining. (G) Quantification of the necrotic cells percentage induced by HS analyzed by flow cytometry with Annexin V-FITC/PI staining. The data shown represent the mean ± SD from at least three independent experiments performed in triplicate. *p < 0.05, compared to the control (37 °C) group; #p < 0.05, compared to the HS (43 °C) group.
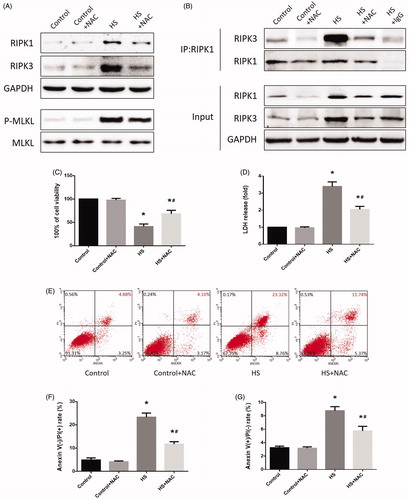
Figure 7. Scavenging ROS production reduced HS-induced RIPK1/RIPK3-dependent mitochondrial ROS production and promoted MMP recovery. IEC-6 cells were pretreated with or without 2 mM NAC, then underwent HS (43°C) for 2h and were further incubated at 37°C for 24h. A. Cells were treated with 4μM MitoSOX for mitochondrial superoxide detection. Flow cytometry was used to analyze HS-induced mitochondrial superoxide. B. Quantification of the mitochondrial superoxide induced by HS. C. Quantification of the malondialdehyde (MDA) levels induced by HS. D. Quantification of the superoxide dismutase (SOD) levels induced by HS. E. Cells were labeled with 5 μmol/L JC-1. Flow cytometry was used to analyze HS-induced mitochondrial depolarization (low ΔΨm). F. Quantification of the low ΔΨm percentage induced by HS analyzed by flow cytometry. The data shown represent the mean ±SD from at least three independent experiments performed in triplicate. *P < 0.05, compared to the control (37°C) group; #P < 0.05, compared to the HS (43°C) group.
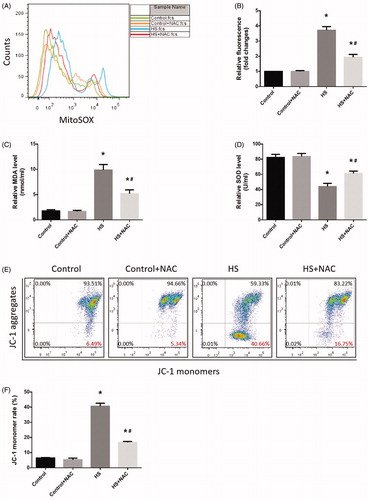
Figure 8. Scavenging ROS production improved HS-induced RIPK1/RIPK3-dependent mice survival. Mice were pretreated with or without 100mg/kg NAC (intraperitoneal) at 1h followed by exposure to a temperature controlled chamber (ambient temperature 35.5±0.5°C and 60±5% relative humidity) until rectal core temperature (Tc) reached 42°C. The mice were sacrificed at 20h after HS exposure and the small intestine (ileum) was isolated. RIPK1, RIPK3, phosphorylated MLKL, and MLKL levels were detected by Western blot (n=8). B. RIPK1-RIPK3 complexes were detected by immunoprecipitation assay with IgG serving as the negative control (n=8). C. Kaplan-Meier results showing mice survival duration in each group (n=8). *P < 0.05, compared to the control (37°C) group; #P < 0.05, compared to the HS group.
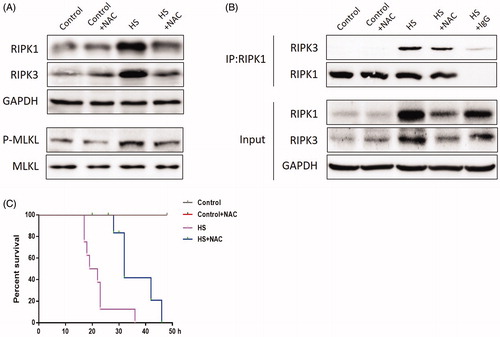
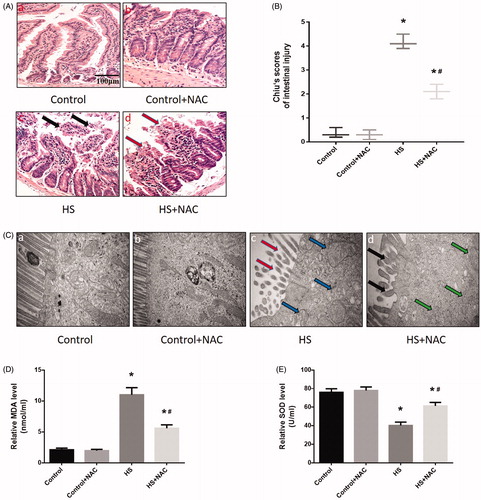
Figure 9. Scavenging ROS production reduced HS-induced intestinal damage in vivo. Mice were pretreated with or without 100 mg/kg NAC (intraperitoneal) at 1 h followed by exposure to a temperature controlled chamber (ambient temperature 35.5 ± 0.5 °C and 60 ± 5% relative humidity) until rectal core temperature (Tc) reached 42 °C. The mice were sacrificed at 20 h after HS exposure and the small intestine (ileum) was isolated. (A) Histopathology changes in the ileum were detected by H&E staining (magnification ×200). HS resulted in profound damage to the small intestine epithelium, manifested as villous stroma broadening, focal necrosis, and some epithelial cell detachment accompanied by marked edema and congestion (A-c, black arrows). (B) Intestinal injury was evaluated by Chiu scores in mice. (C) The ileum ultrastructure was observed by TEM. Changes in microvillus height (C-c, red arrows), and mitochondria (C-c, blue arrows) were apparent in HS group ileum. (D) Quantification of the malondialdehyde (MDA) levels induced by HS. (E) Quantification of the superoxide dismutase (SOD) levels induced by HS. *p < 0.05, compared to the control (37 °C) group; #p < 0.05, compared to the HS group, (n = 6).